Download
1 / 4
40 likes | 59 Views
You have jumped into the cryptoverse! Welcome to the 52nd edition of The Quantitative Investor, a weekly newsletter for those who want to dive deep into the metrics of various financial markets, with a focus on cryptocurrencies, and visualize data not often presented elsewhere. The main objectives of this newsletter are to graph key metrics, identify any trends or correlations, and present the data which will help the reader understand long-term price movements.<br>#TheQuantitativeInvestor<br>

E N D
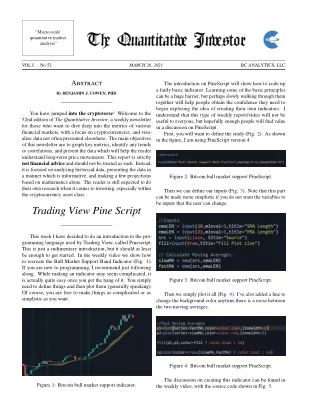
”Macro-scale quantitative market analysis” T Quantitati In`tor MARCH 26, 2021 VOL.I. . . No.52 BC ANALYTICS, LLC Abstract The introduction on PineScript will show how to code up a fairly basic indicator. Learning some of the basic principles can be a huge barrier, but perhaps slowly walking through them together will help people obtain the confidence they need to begin exploring the idea of creating their own indicators. I understand that this type of weekly report/video will not be useful to everyone, but hopefully enough people will find value in a discussion on PineScript. First, you will want to define the study (Fig. 2). As shown in the figure, I am using PineScript version 4. By BENJAMIN J. COWEN, PHD You have jumped into the cryptoverse! Welcome to the 52nd edition of The Quantitative Investor, a weekly newsletter for those who want to dive deep into the metrics of various financial markets, with a focus on cryptocurrencies, and visu- alize data not often presented elsewhere. The main objectives of this newsletter are to graph key metrics, identify any trends or correlations, and present the data which will help the reader understand long-term price movements. This report is strictly not financial advice and should not be treated as such. Instead, it is focused on analyzing historical data, presenting the data in a manner which is informative, and making a few projections based on mathematics alone. The reader is still expected to do their own research when it comes to investing, especially within the cryptocurrency asset class. Trading View Pine Script Figure 2: Bitcoin bull market support PineScript. Then we can define our inputs (Fig. 3). Note that this part can be made more simplistic if you do not want the variables to be inputs that the user can change. This week I have decided to do an introduction to the pro- gramming language used by Trading View, called Pinescript. This is just a rudimentary introduction, but it should at least be enough to get started. In the weekly video we show how to recreate the Bull Market Support Band Indicator (Fig. 1). If you are new to programming, I recommend just following along. While making an indicator may seem complicated, it is actually quite easy once you get the hang of it. You simply need to define things and then plot them (generally speaking). Of course, you are free to make things as complicated or as simplistic as you want. Figure 3: Bitcoin bull market support PineScript. Then we simply plot it all (Fig. 4). I’ve also added a line to change the background color anytime there is a cross between the two moving averages. Figure 4: Bitcoin bull market support PineScript. The discussion on creating this indicator can be found in the weekly video, with the source code shown in Fig. 5. Figure 1: Bitcoin bull market support indicator.
The Quantitative Investor MARCH 26, 2021 2 VOL.I. . . No.52 Asset BTC ETH LTC ADA LINK XRP XMR SPX Price $53683 $1660 $181 $1.20 $26.88 $0.55 $219 $3927 Risk 0.771 0.546 0.558 0.573 0.569 0.329 0.484 0.818 Risk (Last Wk) 0.854 0.584 0.604 0.630 0.617 0.310 0.510 0.829 Figure 5: Bitcoin bull market support PineScript. Risk 2000 1 1800 0.9 1600 0.8 1400 0.7 105 1 ETH Price ($) 1200 0.6 0.9 1000 0.5 104 0.8 800 0.4 0.7 600 0.3 BTC Price ($) 103 0.6 400 0.2 0.5 200 0.1 102 0.4 0 Jan 2019 Jul 2019 Jan 2020 Jul 2020 Jan 2021 0.3 Figure8: Etherpricevs. timewithacolor-codedriskdimension. 101 0.2 0.1 100 0 2012 2013 2014 2015 2016 2017 2018 2019 2020 2021 Figure 6: Bitcoin price vs. time with a color-coded risk dimen- sion. 105 104 1 1 Price Risk 0.9 0.9 104 103 0.8 0.8 103 0.7 0.7 BTC Price ($) ETH Price ($) 102 0.6 0.6 102 Risk Risk 0.5 0.5 101 101 0.4 0.4 0.3 0.3 100 100 0.2 0.2 10-1 0.1 0.1 10-2 10-1 0 0 2010 2012 2014 2016 2018 2020 2016 2017 2018 2019 2020 2021 Figure 7: Bitcoin price (primary y-axis) and risk (secondary y-axis) vs. time. Figure 9: Ether price (primary y-axis) and risk (secondary y-axis) vs. time.
The Quantitative Investor MARCH 26, 2021 3 VOL.I. . . No.52 103 103 1 1 Price Risk 0.9 0.9 0.8 0.8 102 0.7 0.7 102 0.6 LTC Price ($) BNB ($) 0.6 Risk 101 0.5 0.5 0.4 0.4 0.3 101 100 0.3 0.2 0.2 0.1 10-1 0.1 0 Jan 2018 Jan 2019 Jan 2020 Jan 2021 100 2013 2014 2015 2016 2017 2018 2019 2020 2021 Figure 13: Cardano price (primary y-axis) and risk (secondary y-axis) vs. time. Figure 10: Litecoin price vs. time with a color-coded risk dimension. 103 1 103 1 0.9 Price Risk 0.9 0.8 0.8 102 0.7 0.7 102 LTC Price ($) 0.6 0.6 XMR ($) Risk 101 0.5 0.5 0.4 0.4 101 0.3 0.3 100 0.2 0.2 0.1 0.1 100 0 2015 2016 2017 2018 2019 2020 2021 10-1 2015 2016 2017 2018 2019 2020 2021 Figure 11: Litecoin price (primary y-axis) and risk (secondary y-axis) vs. time. Figure 14: Monero price vs. time with a color-coded risk dimension. 103 1 103 1 0.9 Price Risk 0.9 0.8 0.8 102 102 0.7 0.7 0.6 0.6 BNB ($) XMR ($) 101 Risk 0.5 101 0.5 0.4 0.4 0.3 0.3 100 100 0.2 0.2 0.1 0.1 10-1 0 10-1 2015 2016 2017 2018 2019 2020 2021 Jan 2018 Jan 2019 Jan 2020 Jan 2021 Figure 15: Monero price (primary y-axis) and risk (secondary y-axis) vs. time. Figure 12: Cardano price vs. time with a color-coded risk dimension.
The Quantitative Investor MARCH 26, 2021 4 VOL.I. . . No.52 4000 1 1 0.9 0.9 3800 0.8 0.8 3600 101 0.7 0.7 3400 S&P 500 ($) 0.6 0.6 LINK ($) 3200 0.5 0.5 3000 0.4 0.4 100 2800 0.3 0.3 2600 0.2 0.2 2400 0.1 0.1 2200 0 10-1 Jan 2017 Jan 2018 Jan 2019 Jan 2020 Jan 2021 Jan 2022 Jan 2018 Jan 2019 Jan 2020 Jan 2021 Figure 18: Price of the S&P 500 vs. time with a color-coded risk dimension. Figure 16: Chainlink price vs. time with a color-coded risk dimension. 104 1 1 Price Risk 0.9 0.9 101 0.8 0.8 103 0.7 0.7 S&P 500 ($) 0.6 0.6 LINK ($) Risk Risk 102 0.5 0.5 100 0.4 0.4 0.3 0.3 101 0.2 0.2 Price ($) Risk 0.1 0.1 100 10-1 0 0 1920 1940 1960 1980 2000 2020 Jan 2018 Jan 2019 Jan 2020 Jan 2021 Figure 17: Chainlink price (primary y-axis) and risk (secondary y-axis) vs. time. Figure 19: S&P 500 price (primary y-axis) and risk (secondary y-axis) vs. time.