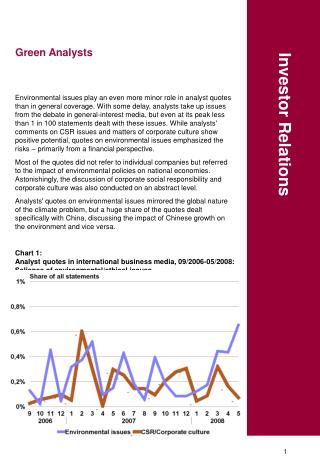
Investor Relations
260 likes | 419 Views
Banco do Brasil. Investor Relations. Structure. General Shareholders Meeting. Board of Auditors. Board of Directors. Audit Committee. Internal Audit. Board of Officers. CEO. VP of International Business and Wholesale. VP of Retail Service and Distribution. VP of Rural

Investor Relations
E N D
Presentation Transcript
Banco do Brasil Investor Relations
Structure General Shareholders Meeting Board of Auditors Board of Directors Audit Committee Internal Audit Board of Officers CEO VP of International Business and Wholesale VP of Retail Service and Distribution VP of Rural Businesses and Government Affairs VP of Finance, Capital Market and Investor Relations VP of Technology and Logistic VP of Human Resources and Social-Enviro- nmental Responsibility VP of Credit, Controlling and Risk Management Employee Relation And Social-Env. Responsibility Micro and Small Businesses Distribution and Retail Channels Government Affairs Capital Markets and Investments Human Resources Restructuring of Operational Assets Strategy and Organization Marketing and Communication Foreign Trade Commercial International Retail Services Agribusiness Finance Technology Logistic Risk Management Controlling Credit Legal Internal Controls Information Technology Software Development Accounting High Income Investor Relations Security Management Executive Secretariat Directorships Regional Sustainable Development Units Autonomous Departments
Group Structure Multiple Bank COBRA BB – 99.36% ON BB Leasing BB – 100% ON BB Corretora de Seguros BB – 100% ON Banco Popular do Brasil BB – 100% ON BB DTVM BB – 100% ON BB Viena BB – 100% ON BB Leasing Company BB – 100% ON BB BI BB – 100% ON BB Consórcios BB – 100% ON BB Securities LLC BB – 100% ON BAMB BB – 100% ON BB Cartões BB – 100% ON BB Previdência Ativos S.A. BB BI – 49% ON BAMB – 51% ON BB Securities BAMB – 100% ON BB Turismo BAMB – 99.996% ON Brasilseg BB BI – 40% ON Brasilprev BB BI – 49.99% ON Aliança do Brasil BB BI – 40% ON Visa Vale BB BI – 35% ON Visanet BB BI Classe A 35% Classe B 28.76% Total 31.99% Brasilveículos Brasilseg 100%ON Brasilsaúde BB BI – 49.92% ON Brasilcap BB BI – 49.99% ON Cibrasec BB BI -10% ON SBCE BB BI – 12.088% ON
Before After Shareholders Quantity of Shares % Quantity of Shares % National Treasury 584,778,036 72.1 584,778,036 70.9 PREVI 112,415,335 13.9 94,415,335 11.4 BNDESPar 46,604,052 5.7 23,604,052 2.9 Treasury Stocks 11,257,677 1.4 - 0.0 Foreign Capital 26,682,549 3.3 55,011,343 6.7 Others 28,879,766 3.6 67,507,657 8.2 Total 810,617,415 100.0 825,316,423 100.0 Free Float 55,562,315 6.9 122,519,000 14.8 Shareholder Base Shareholding Breakdown before and after the Public Offering and Subscription Warrants
CAGR BB – 13.4% Industry – 10.8% Market Share 16.6% Market Share 15.0% CAGR BB – 14.9% Industry – 10.6% Highlights Assets - R$ billion 3Q06 281.6 2005 253.0 2004 239.0 2003 230.1 2002 204.6 2001 165.1 2000 138.4 Credit Operations¹ - R$ billion 1999 126.5 1998 129.6 99.5 2Q06 1997 108.9 2005 86.0 1996 82.6 2004 74.8 65.6 2003 2002 51.4 2001 40.2 2000 36.0 29.0 1999 28.5 1998 1997 26.1 25.7 1996 (1) Deducted by Provisions
CAGR BB - 26.0% Industry - 24.5% Market Share 19.8% Market Share 19.7% CAGR BB – 12.7% Industry – 12.1% Highlights Asset Management - R$ billion 3Q06 180.6 2005 153.5 2004 124.0 2003 102.7 2002 66.2 2001 61.4 2000 48.0 Deposits - R$ billion 1999 35.2 1998 38.0 3Q06 144.9 1997 23.0 2005 137.7 1996 18.9 2004 115.5 2003 110.0 2002 97.3 2001 73.4 2000 65.7 1999 72.2 1998 61.0 1997 55.3 1996 45.2
Highlights Points of Service - thousand 3Q06 4.0 11.0 15.0 2005 3.9 10.9 14.8 2004 3.7 10.7 14.4 2003 3.2 10.0 13.2 2002 3.2 9.2 12.3 2001 3.0 8.0 11.0 2000 2.9 4.6 7.5 ATM Network - thousand 1999 2.9 4.3 7.2 2.8 2.7 5.5 1998 3Q06 42.6 1997 2.8 1.6 4.4 2005 40.2 1996 2.9 1.5 4.4 2004 39.0 2003 37.0 Branches Others 2002 33.6 2001 32.3 2000 30.1 1999 24.5 1998 12.5 1997 6.9 1996 4.1
Highlights Account Holders - million 1.5 22.6 3Q06 24.1 1.4 21.5 2005 22.9 1.4 19.7 2004 21.1 1.2 17.5 2003 18.8 2002 1.0 14.4 15.4 13.8 2001 0.9 12.9 2000 0.9 11.8 12.7 Employees - thousand 1999 0.8 10.1 10.9 1998 0.7 9.4 10.1 3Q06 82.6 1997 7.9 0.8 7.1 2005 83.8 1996 0.6 5.6 6.2 2004 82.7 2003 80.6 Businesses Individuals 2002 78.6 2001 78.1 2000 78.2 1999 69.4 1998 72.4 1997 76.4 1996 85.3
Performance Coverage Ratio¹ - % 9M06 113.4 2005 103.9 2004 93.1 2003 80.6 2002 80.3 Cost Income Ratio² - % 2001 67.4 9M06 46.5 2000 55.9 2005 48.1 1999 55.7 2004 54.2 2003 55.8 2002 57.9 71.8 2001 80.9 2000 92.2 1999 (1) Service Revenues / Personnel Expenses (2) Administrative Expenses / Operating Income
Performance Net Income - R$ million 4,796 9M06 2005 4,154 2004 3,024 2003 2,381 2002 2,028 2001 1,082 2000 974 ROE - % 1999 843 1998 870 9M06 35.9 1997 574 2005 26.8 (7,526) 1996 2004 23.0 2003 22.3 2002 22.6 2001 12.9 2000 12.8 1999 11.6 1998 13.1 1997 9.6 (134.6) 1996
Performance Market Capitalization - R$ million 39,203 9M06 34,110 2005 2004 25,979 2003 17,568 2002 7,174 2001 8,103 2000 4,641 Dividends - R$ million 1999 6,747 1998 5,328 1,555 1H06 1997 5,455 1,498 2005 1996 6,607 954 2004 745 2003 579 2002 265 2001 258 2000 236 1999 243 1998 164 1997 - 1996
Performance 706.4% 417.7% Sep/06 Dec/96 Dec/97 Dec/98 Dec/99 Dec/00 Dec/01 Dec/02 Dec/03 Dec/04 Dec/05 BBAS3 IBOV
Credit Retail Portfolio – R$ billion 37.5 31.0 27.5 21.6 12.6 11.3 Commercial Portfolio – R$ billion 2001 2002 2003 2004 2005 Sep/06 16.6 14.0 13.9 12.2 11.6 10.4 2001 2002 2003 2004 2005 Sep/06
40.3 35.7 30.0 27.2 16.8 11.7 2001 2002 2003 2004 2005 Sep/06 Credit Agribusiness Portfolio – R$ billion
Credit ACC/ACE Contracted Volume – US$ billion 11.9 9.0 9.0 7.6 5.5 5.3 Foreign Trade Portfolio – R$ billion 10.5 2001 2002 2003 2004 2005 9M06 9.6 8.0 7.6 7.3 6.2 2001 2002 2003 2004 2005 Sep/06
Credit R$ million 2Q06 - % 3Q06 - % 8.7 8.8 19.1 19.6 35.3 34.1 14.7 14.0 22.2 23.6 Individuals SMEs Businesses Agribusiness Abroad
Funding Funding – R$ million
Credit Cards Quantity of Credit Cards issued – in million 11.4 9.3 6.9 5.3 4.7 3.8 2001 2002 2003 2004 2005 Jun/06
Insurance Automobile Insurance 647 625 578 500 349.8 445 318.6 238.7 171.8 136.1 2002 2003 2004 2005 Sep/06 Managed portfolio - R$ million Covered Cars – thousand
Insurance Life Insurance 1,697 1,417 1,351 1,263 1,224 728.2 717.1 680.6 570.5 441.6 2002 2003 2004 2005 Sep/06 Managed portfolio - R$ million Contracts – thousand
Insurance Open-ended Pension Fund 1,713 1,576 1,365 1,178 11,634 9,659 886 7,781 5,586 3,785 2002 2003 2004 2005 Sep/06 Managed portfolio - R$ million Active Participants – thousand
Insurance Capitalization Bonds 2,949 2,840 2,792 2,661 2,631 2,875 2,834 2,264 2,060 1,549 2002 2003 2004 2005 Sep/06 Managed portfolio - R$ million Quantity of Bonds – thousand
Infrastructure and Technology Distribution Network Northeast North Branches 993 Others 2,863 Total 3,856 Branches 240 Others 905 Total 1,145 Midwest Branches 389 Others 1,316 Total 1,706 Southeast Branches 1,528 Others 3,931 Total 5,459 South Branches 809 Others 2,067 Total 2,876
Infrastructure and Technology Transactions in Automated Channels - % 89.4 89.2 88.4 86.4 84.1 78.6 2001 2002 2003 2004 2005 Sep/06 Breakdown of Transactions - % Sep/05 Sep/06 4.0 4.1 7.1 6.1 11.6 10.6 48.2 49.6 14.8 16.9 13.8 13.1 ATM Internet Businesses Internet Individuals Cashier POS Others
Highlights R$ million (1) Credit Operations characteristics only (2) Past Due Loans + 60 days
For further information access www.bb.com.br/ri Investor Relations Unit SBS - Quadra 1 - Bloco C - Ed. Sede III - 5° floor 70073-901 - Brasília (DF) Phone: 55 (61) 3310.3980 Fax: 55 (61) 3310.3735 www.bb.com.br ri@bb.com.br Disclaimer- This presentation contains references and statements, planned synergies, increasing estimates, projections of results and future strategy for Banco do Brasil, it’s Associated and Affiliated Companies and Subsidiaries. Although these references and statements reflect the management’s belief, it also involves imprecision and high difficult risks to be foreseen, consequently, it may conduct to a different result than the one anticipated here. These expectations are highly depended on market conditions, on the Brazilian economic performance, on the sector and the international market. Banco do Brasil is not responsible for bringing up to date any estimate in this presentation.