Download
1 / 5
50 likes | 66 Views
You have jumped into the cryptoverse! Welcome to the 50th edition of The Quantitative Investor, a weekly newsletter for those who want to dive deep into the metrics of various financial markets, with a focus on cryptocurrencies, and visualize data not often presented elsewhere.<br>#TheQuantitativeInvestor

E N D
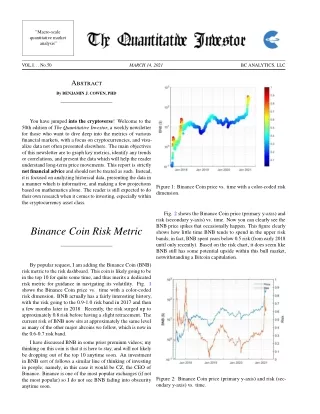
”Macro-scale quantitative market analysis” T Quantitati In`tor MARCH 14, 2021 VOL.I. . . No.50 BC ANALYTICS, LLC Abstract By BENJAMIN J. COWEN, PHD You have jumped into the cryptoverse! Welcome to the 50th edition of The Quantitative Investor, a weekly newsletter for those who want to dive deep into the metrics of various financial markets, with a focus on cryptocurrencies, and visu- alize data not often presented elsewhere. The main objectives of this newsletter are to graph key metrics, identify any trends or correlations, and present the data which will help the reader understand long-term price movements. This report is strictly not financial advice and should not be treated as such. Instead, it is focused on analyzing historical data, presenting the data in a manner which is informative, and making a few projections based on mathematics alone. The reader is still expected to do their own research when it comes to investing, especially within the cryptocurrency asset class. Figure 1: Binance Coin price vs. time with a color-coded risk dimension. Fig. 2 shows the Binance Coin price (primary y-axis) and risk (secondary y-axis) vs. time. Now you can clearly see the BNB price spikes that occasionally happen. This figure clearly shows how little time BNB tends to spend in the upper risk bands; in fact, BNB spent years below 0.5 risk (from early 2018 until only recently). Based on the risk chart, it does seem like BNB still has some potential upside within this bull market, notwithstanding a Bitcoin capitulation. Binance Coin Risk Metric By popular request, I am adding the Binance Coin (BNB) risk metric to the risk dashboard. This coin is likely going to be in the top 10 for quite some time, and thus merits a dedicated risk metric for guidance in navigating its volatility. Fig. 1 shows the Binance Coin price vs. time with a color-coded risk dimension. BNB actually has a fairly interesting history, with the risk going to the 0.9-1.0 risk band in 2017 and then a few months later in 2018. Recently, the risk surged up to approximately 0.8 risk before having a slight retracement. The current risk of BNB now sits at approximately the same level as many of the other major altcoins we follow, which is now in the 0.6-0.7 risk band. I have discussed BNB in some prior premium videos; my thinking on this coin is that it is here to stay, and will not likely be dropping out of the top 10 anytime soon. An investment in BNB sort of follows a similar line of thinking of investing in people; namely, in this case it would be CZ, the CEO of Binance. Binance is one of the most popular exchanges (if not the most popular) so I do not see BNB fading into obscurity anytime soon. Figure 2: Binance Coin price (primary y-axis) and risk (sec- ondary y-axis) vs. time.
The Quantitative Investor MARCH 14, 2021 2 VOL.I. . . No.50 I may convert one crypto for another). Right now, the total cryptocurrency market cap risk is 0.882, so this is definitely too risky of a time for me to come in with fresh money. I will of course keep people updated if this changes. Risk Figure 3: BNB/BTC (primary y-axis) and risk (secondary y-axis) vs. time. 105 1 0.9 104 0.8 Fig. 3 shows BNB/BTC (primary y-axis) and risk (sec- ondary y-axis) vs. time. The BNB/BTC risk is actually much lower than the BNB/USD risk because the valuation of BTC has also gone up significantly. In the last year alone, the price of BTC has moved up by approximately 15x! Because the BNB/BTC risk metric is still only in the 0.4-0.5 risk band, it seems like it could stand to go higher whenever BTC volatility cools off, and altcoins can have a couple weeks to rally. For completeness, Fig. 4 shows BNB/BTC (primary y-axis) and risk (secondary y-axis) vs. time. Given that the BNB/BTC risk has gone to much higher risk bands than where we currently are located, it seems like a high probability there is still a decent amount of upside for BNB during this market cycle. 0.7 BTC Price ($) 103 0.6 0.5 102 0.4 0.3 101 0.2 0.1 100 0 2012 2013 2014 2015 2016 2017 2018 2019 2020 2021 Figure 5: Bitcoin price vs. time with a color-coded risk dimen- sion. 105 1 Price Risk 0.9 104 0.8 103 0.7 BTC Price ($) 0.6 102 Risk 0.5 101 0.4 0.3 100 Figure 4: BNB/BTC (primary y-axis) and risk (secondary y-axis) vs. time. 0.2 10-1 0.1 10-2 0 I do not currently own BNB but I may pick some up on a sizable pullback within the entire cryptocurrency asset class. Whenever the total cryptocurrency market cap risk is above 0.7, I am very hesitant to buy any crypto (though sometimes 2010 2012 2014 2016 2018 2020 Figure 6: Bitcoin price (primary y-axis) and risk (secondary y-axis) vs. time.
The Quantitative Investor MARCH 14, 2021 3 VOL.I. . . No.50 Asset BTC ETH LTC ADA LINK XRP XMR SPX Price $60334 $1879 $218 $1.08 $29.43 $0.45 $233 $3943 Risk 0.876 0.601 0.624 0.590 0.618 0.301 0.510 0.829 Risk (Last Wk) 0.815 0.586 0.595 0.631 0.617 0.310 0.491 0.793 103 1 0.9 0.8 0.7 102 LTC Price ($) 0.6 0.5 0.4 101 0.3 0.2 0.1 2000 1 100 2013 2014 2015 2016 2017 2018 2019 2020 2021 1800 0.9 Figure 9: Litecoin price vs. time with a color-coded risk dimension. 1600 0.8 1400 0.7 ETH Price ($) 1200 0.6 1000 0.5 800 0.4 600 0.3 400 0.2 200 0.1 0 Jan 2019 Jul 2019 Jan 2020 Jul 2020 Jan 2021 Figure7: Etherpricevs. timewithacolor-codedriskdimension. 104 1 103 1 0.9 Price Risk 0.9 103 0.8 0.8 0.7 0.7 102 ETH Price ($) 102 0.6 LTC Price ($) 0.6 Risk Risk 0.5 0.5 101 0.4 0.4 101 0.3 0.3 100 0.2 0.2 0.1 0.1 10-1 100 0 0 2016 2017 2018 2019 2020 2021 2015 2016 2017 2018 2019 2020 2021 Figure 8: Ether price (primary y-axis) and risk (secondary y-axis) vs. time. Figure 10: Litecoin price (primary y-axis) and risk (secondary y-axis) vs. time.
The Quantitative Investor MARCH 14, 2021 4 VOL.I. . . No.50 1.4 103 1 1 0.9 0.9 1.2 0.8 0.8 102 1 0.7 0.7 0.6 0.6 0.8 XMR ($) ADA ($) 101 0.5 0.5 0.6 0.4 0.4 0.4 0.3 0.3 100 0.2 0.2 0.2 0.1 0.1 10-1 0 2015 2016 2017 2018 2019 2020 2021 Jan 2019 Jul 2019 Jan 2020 Jul 2020 Jan 2021 Figure 13: Monero price vs. time with a color-coded risk dimension. Figure 11: Cardano price vs. time with a color-coded risk dimension. 103 1 1 100 Price Risk Price Risk 0.9 0.9 0.8 0.8 102 0.7 0.7 0.6 0.6 XMR ($) ADA ($) Risk Risk 101 0.5 0.5 10-1 0.4 0.4 0.3 0.3 100 0.2 0.2 0.1 0.1 10-2 10-1 0 0 Jan 2018 Jan 2019 Jan 2020 Jan 2021 2015 2016 2017 2018 2019 2020 2021 Figure 12: Cardano price (primary y-axis) and risk (secondary y-axis) vs. time. Figure 14: Monero price (primary y-axis) and risk (secondary y-axis) vs. time.
The Quantitative Investor MARCH 14, 2021 5 VOL.I. . . No.50 4000 1 1 0.9 0.9 3800 0.8 0.8 3600 101 0.7 0.7 3400 S&P 500 ($) 0.6 0.6 LINK ($) 3200 0.5 0.5 3000 0.4 0.4 100 2800 0.3 0.3 2600 0.2 0.2 2400 0.1 0.1 2200 0 10-1 Jan 2017 Jan 2018 Jan 2019 Jan 2020 Jan 2021 Jan 2022 Jan 2018 Jan 2019 Jan 2020 Jan 2021 Figure 17: Price of the S&P 500 vs. time with a color-coded risk dimension. Figure 15: Chainlink price vs. time with a color-coded risk dimension. 104 1 1 Price Risk 0.9 0.9 101 0.8 0.8 103 0.7 0.7 S&P 500 ($) 0.6 0.6 LINK ($) Risk Risk 102 0.5 0.5 100 0.4 0.4 0.3 0.3 101 0.2 0.2 Price ($) Risk 0.1 0.1 100 10-1 0 0 1920 1940 1960 1980 2000 2020 Jan 2018 Jan 2019 Jan 2020 Jan 2021 Figure 16: Chainlink price (primary y-axis) and risk (secondary y-axis) vs. time. Figure 18: S&P 500 price (primary y-axis) and risk (secondary y-axis) vs. time.