Download
1 / 6
60 likes | 67 Views
You have jumped into the cryptoverse! Welcome to the 49th edition of The Quantitative Investor, a weekly newsletter for those who want to dive deep into the metrics of various financial markets, with a focus on cryptocurrencies, and visualize data not often presented elsewhere.<br>#TheQuantitativeInvestor

E N D
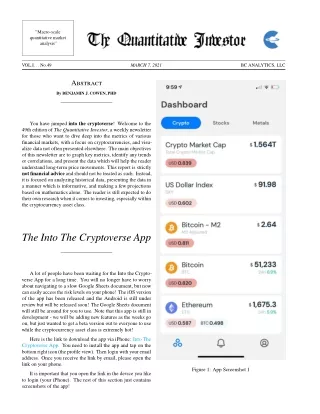
”Macro-scale quantitative market analysis” T Quantitati In`tor MARCH 7, 2021 VOL.I. . . No.49 BC ANALYTICS, LLC Abstract By BENJAMIN J. COWEN, PHD You have jumped into the cryptoverse! Welcome to the 49th edition of The Quantitative Investor, a weekly newsletter for those who want to dive deep into the metrics of various financial markets, with a focus on cryptocurrencies, and visu- alize data not often presented elsewhere. The main objectives of this newsletter are to graph key metrics, identify any trends or correlations, and present the data which will help the reader understand long-term price movements. This report is strictly not financial advice and should not be treated as such. Instead, it is focused on analyzing historical data, presenting the data in a manner which is informative, and making a few projections based on mathematics alone. The reader is still expected to do their own research when it comes to investing, especially within the cryptocurrency asset class. The Into The Cryptoverse App A lot of people have been waiting for the Into the Crypto- verse App for a long time. You will no longer have to worry about navigating to a slow Google Sheets document, but now can easily access the risk levels on your phone! The iOS version of the app has been released and the Android is still under review but will be released soon! The Google Sheets document will still be around for you to use. Note that this app is still in development - we will be adding new features as the weeks go on, but just wanted to get a beta version out to everyone to use while the cryptocurrency asset class is extremely hot! Here is the link to download the app via iPhone: Into The Cryptoverse App. You need to install the app and tap on the bottom right icon (the profile view). Then login with your email address. Once you receive the link by email, please open the link on your phone. It is important that you open the link in the device you like to login (your iPhone). The rest of this section just contains screenshots of the app! Figure 1: App Screenshot 1
The Quantitative Investor MARCH 7, 2021 2 VOL.I. . . No.49 Figure 2: App Screenshot 2 Figure 3: App Screenshot 3
The Quantitative Investor MARCH 7, 2021 3 VOL.I. . . No.49 Figure 4: App Screenshot 4 Figure 5: App Screenshot 5 Risk
The Quantitative Investor MARCH 7, 2021 4 VOL.I. . . No.49 2000 105 1 1 1800 0.9 0.9 1600 104 0.8 0.8 1400 0.7 0.7 ETH Price ($) BTC Price ($) 1200 103 0.6 0.6 1000 0.5 0.5 800 102 0.4 0.4 600 0.3 0.3 400 101 0.2 0.2 200 0.1 0.1 0 100 0 Jan 2019 Jul 2019 Jan 2020 Jul 2020 Jan 2021 2012 2013 2014 2015 2016 2017 2018 2019 2020 2021 Figure8: Etherpricevs. timewithacolor-codedriskdimension. Figure 6: Bitcoin price vs. time with a color-coded risk dimen- sion. 104 1 0.9 103 0.8 0.7 ETH Price ($) 102 0.6 105 1 Risk 0.5 Price Risk 0.9 104 101 0.4 0.8 0.3 103 0.7 100 0.2 BTC Price ($) 0.6 102 0.1 Risk 0.5 10-1 0 101 2016 2017 2018 2019 2020 2021 0.4 Figure 9: Ether price (primary y-axis) and risk (secondary y-axis) vs. time. 0.3 100 0.2 10-1 0.1 103 10-2 1 0 2010 2012 2014 2016 2018 2020 0.9 Figure 7: Bitcoin price (primary y-axis) and risk (secondary y-axis) vs. time. 0.8 0.7 102 LTC Price ($) 0.6 0.5 Asset BTC ETH LTC ADA LINK XRP XMR SPX Price $50741 $1668 $187 $1.13 $27.96 $0.46 $207 $3841 Risk 0.815 0.586 0.595 0.631 0.617 0.310 0.491 0.793 Risk (Last Wk) 0.780 0.554 0.567 0.678 0.597 0.298 0.494 0.785 0.4 101 0.3 0.2 0.1 100 2013 2014 2015 2016 2017 2018 2019 2020 2021 Figure 10: Litecoin price vs. time with a color-coded risk dimension.
The Quantitative Investor MARCH 7, 2021 5 VOL.I. . . No.49 103 103 1 1 Price Risk 0.9 0.9 0.8 0.8 102 0.7 102 0.7 LTC Price ($) 0.6 0.6 Risk XMR ($) 0.5 101 0.5 0.4 101 0.4 0.3 0.2 0.3 100 0.1 0.2 100 0 0.1 2015 2016 2017 2018 2019 2020 2021 10-1 Figure 11: Litecoin price (primary y-axis) and risk (secondary y-axis) vs. time. 2015 2016 2017 2018 2019 2020 2021 Figure 14: Monero price vs. time with a color-coded risk dimension. 1.4 1 0.9 1.2 0.8 1 0.7 0.6 0.8 ADA ($) 0.5 0.6 0.4 0.4 0.3 0.2 0.2 0.1 0 Jan 2019 Jul 2019 Jan 2020 Jul 2020 Jan 2021 Figure 12: Cardano price vs. time with a color-coded risk dimension. 103 1 1 100 Price Risk Price Risk 0.9 0.9 0.8 0.8 102 0.7 0.7 0.6 0.6 XMR ($) ADA ($) Risk Risk 101 0.5 0.5 10-1 0.4 0.4 0.3 0.3 100 0.2 0.2 0.1 0.1 10-2 10-1 0 0 Jan 2018 Jan 2019 Jan 2020 Jan 2021 2015 2016 2017 2018 2019 2020 2021 Figure 13: Cardano price (primary y-axis) and risk (secondary y-axis) vs. time. Figure 15: Monero price (primary y-axis) and risk (secondary y-axis) vs. time.
The Quantitative Investor MARCH 7, 2021 6 VOL.I. . . No.49 4000 1 1 0.9 0.9 3800 0.8 0.8 3600 101 0.7 0.7 3400 S&P 500 ($) 0.6 0.6 LINK ($) 3200 0.5 0.5 3000 0.4 0.4 100 2800 0.3 0.3 2600 0.2 0.2 2400 0.1 0.1 2200 0 10-1 Jan 2017 Jan 2018 Jan 2019 Jan 2020 Jan 2021 Jan 2022 Jan 2018 Jan 2019 Jan 2020 Jan 2021 Figure 18: Price of the S&P 500 vs. time with a color-coded risk dimension. Figure 16: Chainlink price vs. time with a color-coded risk dimension. 104 1 1 Price Risk 0.9 0.9 101 0.8 0.8 103 0.7 0.7 S&P 500 ($) 0.6 0.6 LINK ($) Risk Risk 102 0.5 0.5 100 0.4 0.4 0.3 0.3 101 0.2 0.2 Price ($) Risk 0.1 0.1 100 10-1 0 0 1920 1940 1960 1980 2000 2020 Jan 2018 Jan 2019 Jan 2020 Jan 2021 Figure 17: Chainlink price (primary y-axis) and risk (secondary y-axis) vs. time. Figure 19: S&P 500 price (primary y-axis) and risk (secondary y-axis) vs. time.