Download
1 / 4
40 likes | 48 Views
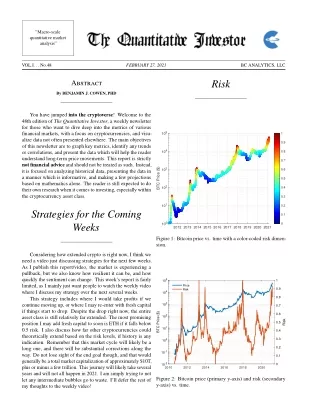
You have jumped into the cryptoverse! Welcome to the 48th edition of The Quantitative Investor, a weekly newsletter for those who want to dive deep into the metrics of various financial markets, with a focus on cryptocurrencies, and visualize data not often presented elsewhere.<br>#TheQuantitativeInvestor

E N D
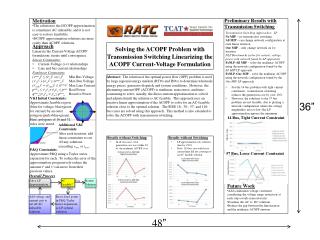
”Macro-scale quantitative market analysis” T Quantitati In`tor FEBRUARY 27, 2021 VOL.I. . . No.48 BC ANALYTICS, LLC Risk Abstract By BENJAMIN J. COWEN, PHD You have jumped into the cryptoverse! Welcome to the 48th edition of The Quantitative Investor, a weekly newsletter for those who want to dive deep into the metrics of various financial markets, with a focus on cryptocurrencies, and visu- alize data not often presented elsewhere. The main objectives of this newsletter are to graph key metrics, identify any trends or correlations, and present the data which will help the reader understand long-term price movements. This report is strictly not financial advice and should not be treated as such. Instead, it is focused on analyzing historical data, presenting the data in a manner which is informative, and making a few projections based on mathematics alone. The reader is still expected to do their own research when it comes to investing, especially within the cryptocurrency asset class. 105 1 0.9 104 0.8 0.7 BTC Price ($) 103 0.6 0.5 102 0.4 0.3 101 0.2 Strategies for the Coming Weeks 0.1 100 0 2012 2013 2014 2015 2016 2017 2018 2019 2020 2021 Figure 1: Bitcoin price vs. time with a color-coded risk dimen- sion. Considering how extended crypto is right now, I think we need a video just discussing strategies for the next few weeks. As I publish this report/video, the market is experiencing a pullback, but we also know how resilient it can be, and how quickly the sentiment can change. This week’s report is fairly limited, as I mainly just want people to watch the weekly video where I discuss my strategy over the next several weeks. This strategy includes where I would take profits if we continue moving up, or where I may re-enter with fresh capital if things start to drop. Despite the drop right now, the entire asset class is still relatively far extended. The most promising position I may add fresh capital to soon is ETH if it falls below 0.5 risk. I also discuss how far other cryptocurrencies could theoretically extend based on the risk levels, if history is any indication. Remember that this market cycle will likely be a long one, and there will be substantial corrections along the way. Do not lose sight of the end goal though, and that would generally be atotalmarketcapitalizationofapproximately $10T, plus or minus a few trillion. This journey will likely take several years and will not all happen in 2021. I am simply trying to not let any intermediate bubbles go to waste. I’ll defer the rest of my thoughts to the weekly video! 105 1 Price Risk 0.9 104 0.8 103 0.7 BTC Price ($) 0.6 102 Risk 0.5 101 0.4 0.3 100 0.2 10-1 0.1 10-2 0 2010 2012 2014 2016 2018 2020 Figure 2: Bitcoin price (primary y-axis) and risk (secondary y-axis) vs. time.
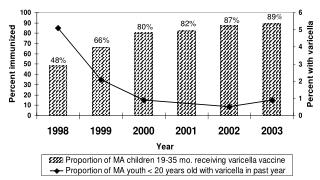
The Quantitative Investor FEBRUARY 27, 2021 2 VOL.I. . . No.48 Asset BTC ETH LTC ADA LINK XRP XMR SPX Price $44797 $1388 $161 $1.18 $24.92 $0.42 $202 $3811 Risk 0.780 0.554 0.567 0.678 0.597 0.298 0.494 0.785 Risk (Last Wk) 0.917 0.649 0.677 0.695 0.706 0.336 0.553 0.833 103 1 0.9 0.8 0.7 102 LTC Price ($) 0.6 0.5 0.4 101 0.3 0.2 0.1 2000 1 100 2013 2014 2015 2016 2017 2018 2019 2020 2021 1800 0.9 Figure 5: Litecoin price vs. time with a color-coded risk dimension. 1600 0.8 1400 0.7 ETH Price ($) 1200 0.6 1000 0.5 800 0.4 600 0.3 400 0.2 200 0.1 0 Jan 2019 Jul 2019 Jan 2020 Jul 2020 Jan 2021 Figure3: Etherpricevs. timewithacolor-codedriskdimension. 104 1 103 1 0.9 Price Risk 0.9 103 0.8 0.8 0.7 0.7 102 ETH Price ($) 102 0.6 LTC Price ($) 0.6 Risk Risk 0.5 0.5 101 0.4 0.4 101 0.3 0.3 100 0.2 0.2 0.1 0.1 10-1 100 0 0 2016 2017 2018 2019 2020 2021 2015 2016 2017 2018 2019 2020 2021 Figure 4: Ether price (primary y-axis) and risk (secondary y-axis) vs. time. Figure 6: Litecoin price (primary y-axis) and risk (secondary y-axis) vs. time.
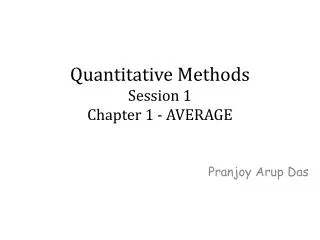
The Quantitative Investor FEBRUARY 27, 2021 3 VOL.I. . . No.48 1.4 103 1 1 0.9 0.9 1.2 0.8 0.8 102 1 0.7 0.7 0.6 0.6 0.8 XMR ($) ADA ($) 101 0.5 0.5 0.6 0.4 0.4 0.4 0.3 0.3 100 0.2 0.2 0.2 0.1 0.1 10-1 0 2015 2016 2017 2018 2019 2020 2021 Jan 2019 Jul 2019 Jan 2020 Jul 2020 Jan 2021 Figure 9: Monero price vs. time with a color-coded risk dimension. Figure 7: Cardano price vs. time with a color-coded risk dimension. 103 1 1 100 Price Risk Price Risk 0.9 0.9 0.8 0.8 102 0.7 0.7 0.6 0.6 XMR ($) ADA ($) Risk Risk 101 0.5 0.5 10-1 0.4 0.4 0.3 0.3 100 0.2 0.2 0.1 0.1 10-2 10-1 0 0 Jan 2018 Jan 2019 Jan 2020 Jan 2021 2015 2016 2017 2018 2019 2020 2021 Figure 8: Cardano price (primary y-axis) and risk (secondary y-axis) vs. time. Figure 10: Monero price (primary y-axis) and risk (secondary y-axis) vs. time.
The Quantitative Investor FEBRUARY 27, 2021 4 VOL.I. . . No.48 4000 1 1 0.9 0.9 3800 0.8 0.8 3600 101 0.7 0.7 3400 S&P 500 ($) 0.6 0.6 LINK ($) 3200 0.5 0.5 3000 0.4 0.4 100 2800 0.3 0.3 2600 0.2 0.2 2400 0.1 0.1 2200 0 10-1 Jan 2017 Jan 2018 Jan 2019 Jan 2020 Jan 2021 Jan 2022 Jan 2018 Jan 2019 Jan 2020 Jan 2021 Figure 13: Price of the S&P 500 vs. time with a color-coded risk dimension. Figure 11: Chainlink price vs. time with a color-coded risk dimension. 104 1 1 Price Risk 0.9 0.9 101 0.8 0.8 103 0.7 0.7 S&P 500 ($) 0.6 0.6 LINK ($) Risk Risk 102 0.5 0.5 100 0.4 0.4 0.3 0.3 101 0.2 0.2 Price ($) Risk 0.1 0.1 100 10-1 0 0 1920 1940 1960 1980 2000 2020 Jan 2018 Jan 2019 Jan 2020 Jan 2021 Figure 12: Chainlink price (primary y-axis) and risk (secondary y-axis) vs. time. Figure 14: S&P 500 price (primary y-axis) and risk (secondary y-axis) vs. time.