Download
1 / 51
510 likes | 781 Views
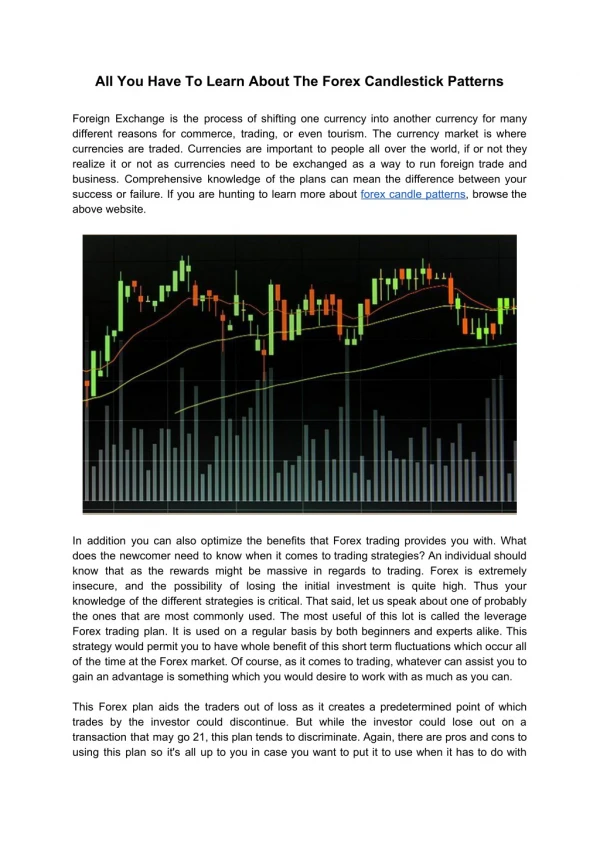
https://dailytraders.com/ : Candlestick Patterns School is eBook created to help new Day Traders to start learning patterns, inside the eBook there are top 34 candlestick patterns.<br>

E N D
FIRST EDITION 2023 Candlestick Patterns SIMPLIFIED SCHOOOL 34 candlestick patterns inside
J A N U A R Y 2 0 2 3 INSIDE | CANDLESTICKS INSTAGRAM | TWITTER | FACEBOOK 0 | Introduction 1 | What Are Japanese Candlesticks? 2 | Bullish Reversal Patterns 3 | Bearish Reversal Patterns 4 | Continuation Patterns 5 | Continuation Patterns www.DailyTraders.com
INTRODUCTION Welcome to first Edition of Candlestick Patterns. The collection of patterns comes with basic explanation. We will try to expand eBook in near future with more live examples. This eBook is collection of 34 the most popular candlestick patterns. Understanding candlesticks is essential for anyone who start to learn trade the market The most powerful fact is that you can use this patterns no matter are you planing to trade in Forex or Cryptocurrency market. Of course they are used by traders in stocks and any other market. Each explanation cover pattern illustration, For now we need to start from sowhere. List of top 34 candlestick patterns. Learn basics. Our first goal is to present you all important patterns in the most simple way. He is a wise man who does not grieve for the things which he has not, but rejoices for those which he has. - Epictetus Since this is our first edition mistakes are very possible. Since designers help us to put all together in the eBook. If you find any you can contact us anytime at contact@DailyTraders.com CANDLESTICK PATTERNS | 03
CHAPTER 1 WHAT ARE JAPANESE CANDLESTICKS? INSTAGRAM | TWITTER | FACEBOOK CANDLESTICK PATTERNS | 04
CHAPTER 1 | WHAT ARE JAPANESE CANDLESTICKS? How everything started? Read candlestick history from the screenshot below. Book "Japanese Candlestick Charting Techniques" CANDLESTICK PATTERNS | 05
CHAPTER 1 | WHAT ARE JAPANESE CANDLESTICKS? Japanese Candlestick are using for any time frame, daily, weekly, 1H, 30M… What are Japanese candlesticks? Japanese Candlestick represent price action in certain time frame. For example if we are using 1H time frame, each candle on the char represent price action for 1H. When we switch time frame at 30M, each candle represent price movement in 30M etc. If the decisions you make about where you invest your blood, sweat, and tears are not consistent with the person you aspire to be, you’ll never become that person. - Clayton M. Christensen The body of candlesticks is formed using high, low, open and close for any chosen time frame. CANDLESTICK PATTERNS | 06
CHAPTER 1 | WHAT ARE JAPANESE CANDLESTICKS? Definition: Japanese candlestick is a price chart in trading platforms. They are used to display price for certain period of the time. They are showing open, close, high and low in specific period. There are many different candlesticks but in reality it is simple to understand. Let’s start from the beginning. CANDLESTICK PATTERNS | 07
CHAPTER 1 | WHAT ARE JAPANESE CANDLESTICKS? If the decisions you make about where you invest your blood, sweat, and tears are not consistent with the person you aspire to be, you’ll never become that person. - Clayton M. Christensen 1. If the price close above the open, then we have buy (long) candlestick. On our charts it is a green candles. 2. If the price close below the open, then we have sell (short) candlestick In our examples it is red candlestick. 3. The center (filled part) is called body. 4. Thin lines up and down are called shadows. 5. Upper shadow is high (the highest price reached in that period) 6. Lower shadow represent low (the lowest price in that time frame). CANDLESTICK PATTERNS | 08
CHAPTER 1 | WHAT ARE JAPANESE CANDLESTICKS? Long candlesticks represent buying pressure. Short candlestick represent selling pressure. Longer body means that buying or selling pressure was strong. While smaller candlestick body means smaller buying or selling. CANDLESTICK PATTERNS | 09
CHAPTER 1 | WHAT ARE JAPANESE CANDLESTICKS? Colorful Candlesticks? Check example below, same chart with three variations of colors. Don”t be confused by different colors in different books, websites, trading platforms or videos. Traders usually use green, blue and white for buy (bullish) candlesticks. Red and black for sell (bearish) candlesticks. You can also find them in different colors but when you read this guide you will identify them easily. Courage is the most important of all the virtues because without courage, you can’t practice any other virtue consistently. - Maya Angelou We are using green for buy and red for sell all over the website. Looking at the chart above you probably notice different shape of candles? Price movement create different shapes. You also notice shadows? CANDLESTICK PATTERNS | 10
CHAPTER 1 | WHAT ARE JAPANESE CANDLESTICKS? Japanese Candlestick Shadows Upper shadows tells us the highest price in the candlestick session. The upper and lower shadows on candlesticks provide us important information about candlestick session. Lower shadows tells us the lowest price in the candlestick session. If upper shadow is bigger it means that buyers push the price strong but sellers pressure it down . If lower shadow is bigger it means that sellers push the price but buyers fight back up. CANDLESTICK PATTERNS | 11
CHAPTER 1 | WHAT ARE JAPANESE CANDLESTICKS? Candlestick Patterns Categorized There are three main categories of candlestick patterns. 1. What are Bullish Reversal Patterns Bullish Reversal Candlestick Patterns indicate that the ongoing downtrend is going to end and it may reverse to an uptrend. The Bullish Candlestick Pattern can be single or multiple candlestick patterns. 2. What are Bearish Reversal Patterns Bearish reversals indicate trat ongoing uptrend going to end and it may revrse to an downtrend. The Bearish Candlestick Pattern can be single or multiple candlestick pattern. 3. What are Continuation Patterns Continuation Patterns are confirm that ongoing uptrend will be continue in the same direction. If we have downtrend continuation patterns are confirm continuation of downtrend. Basically they are telling us (confirm) that current trend will continue. CANDLESTICK PATTERNS | 12
CHAPTER 2 BULLISH REVERSAL PATTERNS INSTAGRAM | TWITTER | FACEBOOK 01. 02. 03. 04. 05. 06. 07. 08. 09. 10. 11. 12. 13. Hammer Piercing Pattern Bullish Engulfing The Morning Star Three White Soldiers White Marubozu Three Inside Up Bullish Harami Tweezer Bottom Inverted Hammer Three Outside Up On Neck Pattern Bullish Counterattack
CHAPTER 2 | BULLISH REVERSAL PATTERNS The Hammer is a bullish reversal candlestick pattern that is formed with a single candlestick. The actual body of the candlestick is small and resides at the top of the candle. Hammer The Hammer is a candlestick chart pattern that forms at the end of a downtrend and signals a bullish reversal. There is a shadow under the actual body of the candlestick that makes up almost twice the size of the actual body. The name of the pattern reveals that the market is hammered at the bottom. Hammer candlestick is recognized as one of the most popular candlestick patterns. The completion of this candlestick will indicate that the market will enter a bullish reversal. CANDLESTICK PATTERNS | 14
CHAPTER 2 | BULLISH REVERSAL PATTERNS The Piercing Pattern is a candlestick chart pattern that is formed with two candlesticks. Piercing Bearish The Piercing Pattern is a multiple candlestick chart pattern that forms at the end of a downtrend. The first candlestick is a bearish and indicates a continuing downtrend. After completing the final candlestick in this pattern, the market should become bullish. Which means that pattern indicates bullish reversal. The second candlestick is a bullish reversal candle that first continues in a downward trend before treading upwards and closing above more than 50% of the body of the first candle (image above). CANDLESTICK PATTERNS | 15
CHAPTER 2 | BULLISH REVERSAL PATTERNS The Bullish Engulfing Pattern is a candlestick pattern that is formed using two candlesticks. The first candlestick is a bearish candle and indicates a continuing downtrend. Bullish Engulfing The Bullish Engulfing Pattern comprises of two candlesticks and indicates a bullish reversal. The second candlestick completely engulfs the first one, which is how this pattern was named The second candlestick continues downwards below the first candlestick but quickly reverses and closes above the first candlestick in a bullish reversal. The second candlestick is bigger than the first one and completely engulfs it in this pattern. CANDLESTICK PATTERNS | 16
CHAPTER 2 | BULLISH REVERSAL PATTERNS The Morning Star pattern consists of three candlesticks. The Morning Star The Morning Star pattern is a multiple candlestick pattern that comprises of three candlesticks. The first candlestick is bearish and indicates the continuation of a downtrend. The completion of the third candlestick would indicate that a bullish reversal has taken place. The second candlestick is a Doji which means it is inconclusive and doesn’t indicate anything. The body of this candle has to be outside the body of both the first and third candles. The third candlestick indicates a bullish reversal has begun. CANDLESTICK PATTERNS | 17
CHAPTER 2 | BULLISH REVERSAL PATTERNS The Three White Soldiers is a candlestick pattern that is formed with three candlesticks at the end of a downtrend. Three White Soldiers The Three White Soldiers comprises of three candlesticks and indicates a bullish reversal is taking place. The first candlestick is just a true body and indicates the start of a bullish reversal. These candlesticks have no shadows and are completely just true bodies. The second candlestick is also just a true body and opens within the body of the first candlestick. The pattern is also a true body and opens within the body of the second candlestick. Each candlestick is slightly higher than the other. CANDLESTICK PATTERNS | 18
CHAPTER 2 | BULLISH REVERSAL PATTERNS The White Marubozu consists of a single candlestick that does not have any shadows whatsoever. White Marubozu The White Marubozu is a candlestick chart pattern that consists of a single candlestick. The entire candlestick is a true body and it is a relatively longer candle than most other candlesticks. The formation of this candlestick indicates that a bullish reversal is taking place in the market. The formation of this candle means that a bullish reversal is taking place and that you should be cautious with any open short positions in the market. CANDLESTICK PATTERNS | 19
CHAPTER 2 | BULLISH REVERSAL PATTERNS The Three Inside Up chart pattern consists of three candlesticks. Three Inside Up The Three Inside Up is a candlestick chart pattern that consists of three candlesticks. The first candlestick is a long bearish candlestick that indicates the continuation of a downtrend. The completion of the third candlestick would indicate the start of a bullish reversal. The second candlestick is a short bullish candlestick that indicates the start of a bullish reversal. The combination of the first two candlesticks also forms the Bullish Harami. The third candlestick is a long bullish candlestick that completes the Three Inside Up pattern. CANDLESTICK PATTERNS | 20
CHAPTER 2 | BULLISH REVERSAL PATTERNS The first candlestick is a long bearish candlestick and signifies the continuation of a downtrend. Bullish Harami The Bullish Harami is a candlestick chart pattern that consists of two candlesticks. The second candlestick is a short bullish candlestick and occurs within the body of the first candlestick. The formation of this pattern indicates the end of a downtrend and the start of a bullish reversal. This candlestick is a bullish reversal and signifies the end of a downtrend. CANDLESTICK PATTERNS | 21
CHAPTER 2 | BULLISH REVERSAL PATTERNS The Tweezer Bottom consists of two candlesticks that signify the end of a downtrend. Tweezer Bottom The Tweezer Bottom is a bullish reversal candlestick chart pattern. The first candlestick is a long bearish candlestick that shows that the market is still in a downtrend. This pattern consists of two candlesticks where the first candlestick is long and bearish and the second is short and bullish. The second candlestick forms the next day and has the same lower level as the first candlestick. This candle has a short true body and a shadow that is about the same height as the first candle. The formation of the second candle indicates a bullish reversal. CANDLESTICK PATTERNS | 22
CHAPTER 2 | BULLISH REVERSAL PATTERNS The Inverted Hammer consists of a single candlestick and occurs at the end of a downtrend. Inverted Hammer The Inverted Hammer candlestick pattern occurs at the end of a downtrend and signifies a bullish reversal. The real body is short and is located at the end of the candlestick. This candlestick also has a long upper shadow that makes up the majority of the candle. This pattern consists of only one candlestick with a true body and shadow. This candlestick pattern is called Inverted Hammer because it looks the opposite of the Hammer pattern. CANDLESTICK PATTERNS | 23
CHAPTER 2 | BULLISH REVERSAL PATTERNS The Three Outside Up comprises of three candlesticks. Three Outside Up The Three Outside Up candlestick pattern consists of three candlesticks. The first candlestick is short and bearish, which indicates the continuation of a downtrend. This pattern is formed after a downtrend and indicates that the market is now facing a bullish reversal. The second candlestick is a long bullish candle that consumes the entire body of the first candlestick. The formation of the third candlestick, which is also long and bullish, indicates that the market is now in a bullish reversal. CANDLESTICK PATTERNS | 24
CHAPTER 2 | BULLISH REVERSAL PATTERNS The On-Neck pattern indicates that a bullish reversal is taking place. On Neck Pattern The On-Neck pattern consists of two candlesticks and indicates the end of a downtrend. The first candlestick is bearish and indicates the continuation of a downtrend. This pattern is called On- Neck because the two candlesticks meet together, forming a neckline. The second candlestick is bullish, but its true body opens below the gap of the first candlestick. It then closes near the close of the first candlestick. Since they meet at the same point, this pattern is called the On-Neck pattern. CANDLESTICK PATTERNS | 25
CHAPTER 2 | BULLISH REVERSAL PATTERNS The Bullish Counterattack pattern consists of two candlesticks. Bullish Counterattack The Bullish Counterattack pattern indicates the upcoming bullish reversal in the market. The first candlestick indicates that the market is still in a strong downtrend. This candlestick pattern consists of two candles that must be mainly made of a true body. This candlestick must be mainly a long true body. The second candlestick is also long and closes near the close of the first candlestick. This pattern is similar to the On-Neck pattern but requires a further one or two bullish candles continuing upwards to confirm the bullish reversal. CANDLESTICK PATTERNS | 26
CHAPTER 3 BEARISH REVERSAL PATTERNS INSTAGRAM | TWITTER | FACEBOOK 01. 02. 03. 04. 05. 06. 07. 08. 09. 10. 11. 12. Hanging man Dark Cloud Cover Bearish Engulfing The Evening Star Three Black Crows Black Marubozu Three Inside Down Bearish Harami Shooting Star Tweezer Top Three Outside Down Bearish Counterattack
CHAPTER 3 | BEARISH REVERSAL PATTERNS The Hanging Man consists of a single candlestick. Hanging Man The Hanging Man candlestick pattern is formed after an uptrend and indicates that a bearish reversal is taking place. The real body of this candlestick is short and is found at the top of the candle. The lower half of the candle is a shadow that is twice the length of the real body. This pattern consists of a single candlestick that is mainly a shadow. The top half of the candle has little to no shadow. The formation of this candlestick pattern indicates that a bearish reversal is taking place. CANDLESTICK PATTERNS | 28
CHAPTER 3 | BEARISH REVERSAL PATTERNS The Dark Cloud Cover consists of two candlesticks. Dark Cloud Cover The Dark Cloud Cover is a multiple candlestick chart pattern that consists of two candlesticks. The first candlestick is bullish and indicates the continuation of an uptrend. This pattern is formed after an uptrend and indicates that a bearish reversal is taking place. The second candlestick is bearish and opens within the body of the first candle. It takes up more than half the body of the first candle. The formation of this candle indicates the end of an uptrend and the beginning of a bearish reversal. CANDLESTICK PATTERNS | 29
CHAPTER 3 | BEARISH REVERSAL PATTERNS The Bearish Engulfing consists of two candlesticks that indicate a bearish reversal. Bearish Engulfing The Bearish Engulfing is a multiple candlestick chart pattern that consists of two candlesticks. The first candlestick is a bullish candle that indicates the continuation of an uptrend. The formation of this pattern indicates the end of an uptrend and the start of a bearish reversal. The second candlestick is a bearish candle that is bigger than the first candlestick and completely engulfs it. This is how this candlestick got the name Bearish Engulfing candlestick. CANDLESTICK PATTERNS | 30
CHAPTER 3 | BEARISH REVERSAL PATTERNS The Evening Star consists of three candlesticks that indicate a bearish reversal. The Evening Star The Evening Star is a multiple candlestick chart pattern that consists of three candlesticks. The first candlestick is a bullish candle and indicates the continuation of an uptrend. This candlestick pattern indicates that a bearish reversal is taking place after the end of an uptrend. The second candlestick is found completely outside the body of the first and third candlesticks. This candle is a Doji which indicates that it is uncertain about its market direction. The third candlestick is a bearish candlestick and indicates that a bearish reversal is taking place. CANDLESTICK PATTERNS | 31
CHAPTER 3 | BEARISH REVERSAL PATTERNS The Three Black Crows consists of three candlesticks and indicate the end of an uptrend. Three Black Crows The Three Black Crows is a candlestick chart pattern that consists of three candlesticks. The first candlestick is made of mainly a true body with very little to no shadow. This pattern follows a downtrend where each candlestick is found below the previous candle. The second candlestick is the same and is located slightly lower than the first candlestick. The third candlestick is the same and is located lower than the previous candlesticks. CANDLESTICK PATTERNS | 32
CHAPTER 3 | BEARISH REVERSAL PATTERNS The Black Marubozu consists of a single candlestick that signifies that the bears are back in the market. Black Marubozu The Black Marubozu is a candlestick chart pattern that consists of just a single candlestick. This candlestick is a long bearish candle that is mainly made of a true body with very little to no shadow present. The formation of this pattern indicates the end of an uptrend and the start of a bullish reversal. The formation of this candle indicates that the bears are exerting pressure on the market and causing the market to enter a bearish reversal. CANDLESTICK PATTERNS | 33
CHAPTER 3 | BEARISH REVERSAL PATTERNS The Three Inside Down consists of three candlesticks. The first candlestick is long and bullish, which signifies the continuation of an uptrend. Three Inside Down The Three Inside Down is a candlestick chart pattern that is made up of three candlesticks. This pattern is formed after an uptrend and signifies that a bearish reversal is taking place. The second candlestick is short and bearish. It is found within the range of the first candlestick. The first two candlesticks have the same relationship as the Bearish Harami candlestick pattern. The third candlestick is a long and bearish candle that confirms a bearish reversal in the market. CANDLESTICK PATTERNS | 34
CHAPTER 3 | BEARISH REVERSAL PATTERNS The Bearish Harami consists of two candlesticks. Bearish Harami The Bearish Harami is a candlestick chart pattern that consists of two candlesticks. The first candlestick is a long and bullish candle. This candle signifies that the market is still in an uptrend. This pattern signifies the end of an uptrend. It reveals that the market is now facing a bearish reversal. The second candlestick is a short and bearish candle. This candle occurs within the range of the first candlestick. The formation of the second candle indicates that the market is now in a bearish reversal. CANDLESTICK PATTERNS | 35
CHAPTER 3 | BEARISH REVERSAL PATTERNS The Shooting Star consists of a single candlestick. This candlestick has a small true body that is found at the end of the candle. Shooting Star The Shooting Star is a candlestick chart pattern that consists of a single candlestick. It has a long shadow that is found at the top of the true body and is about twice the size of the true body. This candlestick pattern is the opposite of the Hanging Man pattern and signifies a bearish reversal. This pattern is the inverse of the Hanging Man pattern. Its formation signifies the end of an uptrend and that a bearish reversal has taken place. CANDLESTICK PATTERNS | 36
CHAPTER 3 | BEARISH REVERSAL PATTERNS The Tweezer Top consists of two candlesticks. Tweezer Top The Tweezer Top is a candlestick chart pattern that consists of two candlesticks. The first candlestick is a short and bullish candle that signifies the continuation of an uptrend. This candlestick pattern signifies the end of an uptrend and that a bearish reversal has taken place. The second candlestick is a long and bearish candle. This candle is formed at the same height or market value as the first candlestick. It is formed the day after the first candlestick and signifies the end of an uptrend. CANDLESTICK PATTERNS | 37
CHAPTER 3 | BEARISH REVERSAL PATTERNS The Three Outside Down consists of three candlesticks. Three Outside Down The Three Outside Down is a multiple candlestick chart pattern that consists of three candles. The first candlestick is short and bullish, which signifies the continuation of an uptrend. This pattern is formed at the end of an uptrend and signifies a bullish reversal in the market. The second candlestick is large and bearish. It completely covers the range of the first candlestick. The third candlestick is also long and bearish. The formation of the third candlestick should signify the end of an uptrend. CANDLESTICK PATTERNS | 38
CHAPTER 3 | BEARISH REVERSAL PATTERNS The Bullish Counterattack pattern consists of two candlesticks. Bearish Counterattack The Bearish Counterattack is a multiple candlestick chart pattern that consists of two candles. The first candlestick indicates that the market is still in a strong uptrend. This candlestick must be mainly a long true body. The formation of this pattern signifies the end of an uptrend in the market. The second candlestick is also long and closes near the close of the first candlestick. This pattern requires one or two more candles to continue downwards, confirming the bearish reversal. CANDLESTICK PATTERNS | 39
CHAPTER 4 CONTINUATION PATTERNS INSTAGRAM | TWITTER | FACEBOOK 01. 02. 03. 04. 05. 06. 07. Falling Three Methods Rising Three Methods Upside Tasuki Gap Downside Tasuki Gap Mat Hold Rising Window Falling Window
CHAPTER 4 | CONTINUATION PATTERNS .The Falling Three Methods consists of five candlesticks. Falling Three Methods The Falling Three Methods is a multiple candlestick chart pattern that consists of five candlesticks. The first candlestick indicates the continuation of a downtrend in the market. This pattern indicates the continuation of a downtrend in the market. The next three candlesticks are bullish and signify a temporary uptrend. Finally, the fifth candlestick is bearish and indicates that the market is continuing in a downtrend. This is the opposite of the Rising Three Methods Pattern. CANDLESTICK PATTERNS | 41
CHAPTER 4 | CONTINUATION PATTERNS .Rising three methods is candlestick pattern, made up of five candles where the first and last candles are bearish, moving in the direction of the of main trend. Rising Three Methods Rising three methods is a bullish continuation candlestick pattern that you will notice in an uptrend and his present confirms trend continuation. After the first bearish candle, the second through fourth candles indicate corrective momentum. Then, the fifth candle becomes bearish again and completes the continuation pattern. CANDLESTICK PATTERNS | 42
CHAPTER 4 | CONTINUATION PATTERNS .The Upside Tasuki Gap consists of three candlesticks. Upside Tasuki Gap The Upside Tasuki Gap is a multiple candlestick chart pattern that consists of three candlesticks. The first candle is a long bullish candle which signifies that the market is in an uptrend. This pattern indicates the continuation of an uptrend in the market. The second candle is also a long bullish candle that opens after a gap up in the market. The third candlestick is a short bearish candlestick which indicates that the market is temporarily in a downtrend. This pattern is the opposite of the Downside Tasuki Gap. CANDLESTICK PATTERNS | 43
CHAPTER 4 | CONTINUATION PATTERNS The Downside Tasuki Gap consists of three candlesticks. Downside Tasuki Gap The Downside Tasuki Gap is a multiple candlestick chart pattern that consists of three candlesticks. The first candle is a long bearish candle which signifies that the market is in a downtrend. This pattern indicates the continuation of a downtrend in the market. The second candle is also a long bearish candle that opens after a gap down in the market. The third candlestick is a short bullish candlestick which indicates that the market is temporarily in an uptrend. This pattern is the opposite of the Upside Tasuki Gap. CANDLESTICK PATTERNS | 44
CHAPTER 4 | CONTINUATION PATTERNS The Mat Hold pattern consists of five candlesticks. If the market is in an uptrend, the first candlestick will be a long bullish candle. Mat Hold The Mat Hold is a multiple candlestick chart pattern that consists of five candlesticks. The next three candlesticks will reveal a temporary downtrend in the market as they will be short and bearish. However, they will form above the gap of the first candlestick. This pattern can signify the continuation of either an uptrend or a downtrend in the market. The fifth candlestick will once again be long and bullish to indicate that the market is in an uptrend. This is vice versa if the market is in a downtrend. CANDLESTICK PATTERNS | 45
CHAPTER 4 | CONTINUATION PATTERNS The Rising Window pattern consists of two candlesticks. Rising Window The Rising Window is a multiple candlestick chart pattern that consists of two candlesticks. The first candlestick is a long and bullish candle which indicates that the market is in an uptrend. This pattern indicates the continuation of an uptrend in the market with strong bullish candlesticks. The second candlestick is also a long and bullish candle, but it opens above the gap of the first candle. This gap indicates that there is a strong bull pressure in the market. CANDLESTICK PATTERNS | 46
CHAPTER 4 | CONTINUATION PATTERNS The Falling Window pattern consists of two candlesticks. Falling Window The Falling Window is a multiple candlestick chart pattern that consists of two candlesticks. The first candlestick is a long and bearish candle which indicates that the market is in a downtrend. This pattern indicates the continuation of a downtrend in the market with strong bearish candlesticks. The second candlestick is also a long and bearish candle, but it opens below the gap of the first candle. This gap indicates that there is a strong bear pressure in the market. CANDLESTICK PATTERNS | 47
CHAPTER 5 BULLISH-BEARISH REVERSAL PATTERNS INSTAGRAM | TWITTER | FACEBOOK 01. 02. Doji Spinning Top
CHAPTER 5 | CONTINUATION PATTERNS The Doji is a single candlestick chart pattern. You can identify this candle by looking at its true body. Doji The Doji is a candlestick chart pattern that consists of a single candlestick. This pattern indicates A Doji candle will have a very short true body. It is mainly a long shadow with a short real body in between. uncertainty in the market as both the bulls and bears are applying market pressure. This pattern indicates uncertainty in the market as it is a continuation pattern. CANDLESTICK PATTERNS | 49
CHAPTER 5 | CONTINUATION PATTERNS The Spinning Top consists of a single candlestick. This pattern is similar to the Doji pattern. Spinning Top The Spinning Top is a candlestick chart pattern that indicates uncertainty in the market. The only difference is that the Spinning Top has a slightly taller true body than the Doji candle. This pattern consists of a single candlestick and reveals that the market is continuing the same trend. Despite this, the Spinning Top is still a candle that is mainly made of a shadow. CANDLESTICK PATTERNS | 50