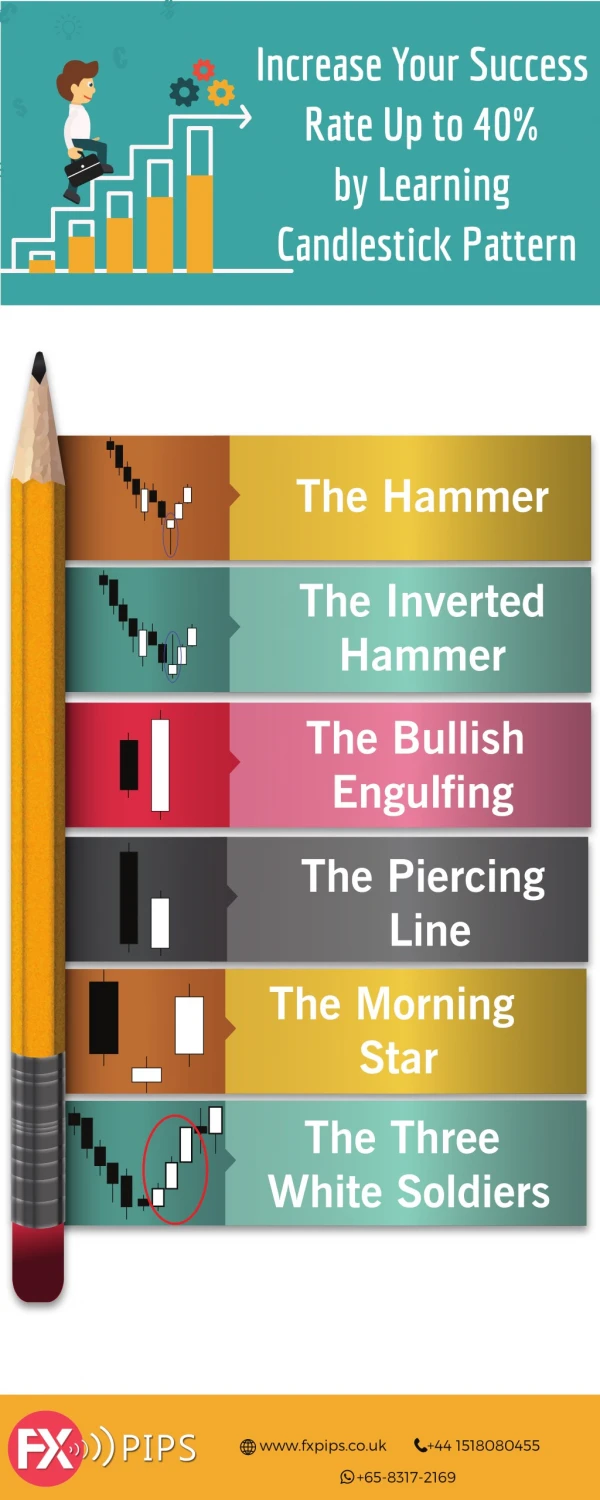
Candlestick Presentation
Original Candlestick Presentation

Candlestick Presentation
E N D
Presentation Transcript
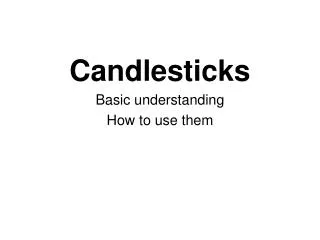
Candlesticks Basic understanding How to use them
Introduction to Candlesticks • Use to time your entry in a stock or option • Identifies possibility of current trend reversal or continuation • Visually Appealing vs. Bar Charts • Must be confirmed by another indicator • Only for markets that have all data
What Candlesticks Tell Us Indicators that signal • A trend reversal • Conformation of trend • Indecision in strength of the Trend
Candlesticks Bullish Real Body Color: -Hollow -White -Green Bearish Real Body Color: -Shaded -Black -Red
GAPS & WINDOWS B. A. C.
The Interactive Chart • On the Graph Tab (Enter your Symbol) • Left Side Under Graph Links Select Interactive Chart • Bottom Left of new Graph Click CLONE button • Maximize Window (if you are blind like me) • Top Left Default setting ‘Bar’ Click down arrow to your right, select ‘Candle’ • Apply Favorite Study Set (Workshop if you are new, or Bowtie covered later)
Candlesticks Review • Helpful to time entry an exit points • Illustrates the battle between Buyers and Sellers. • Not reliable to use as only indicator • Easier to see direction of price moves
Resources* Websites • www.IncredibleCharts.com • www.StockCharts.com • www.HotCandleCharts.com • www.CandleCharts.com • www.HardRightEdge.com Books • Technical Analysis – PRING • Candlesticks - Steve Nision *Other resources are available.


![[PDF READ ONLINE] PDF_ The Candlestick Course read](https://cdn7.slideserve.com/12604437/pdf-the-candlestick-course-download-pdf-read-dt.jpg)
![READ [PDF] Japanese Candlestick Charting Techniques, Second Edition](https://cdn7.slideserve.com/12623244/read-pdf-japanese-candlestick-charting-techniques-dt.jpg)