Download
1 / 28
280 likes | 297 Views
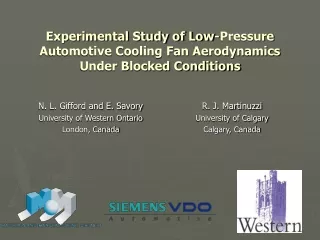
Experimental Study of Low-Pressure Automotive Cooling Fan Aerodynamics Under Blocked Conditions. N. L. Gifford and E. Savory University of Western Ontario London, Canada. R. J. Martinuzzi University of Calgary Calgary, Canada. Alternator. Hood. Bumper. Ram Airflow. Engine Block.

E N D
Experimental Study of Low-Pressure Automotive Cooling Fan Aerodynamics Under Blocked Conditions N. L. Gifford and E. Savory University of Western Ontario London, Canada R. J. Martinuzzi University of Calgary Calgary, Canada
Alternator Hood Bumper Ram Airflow Engine Block Fan Module Condenser (A/C) Radiator I: Introduction • Purpose, constraints, need for better designs • Fan performance is adversely affected by in-situ geometry Major Engine Bay Components
I: In-Situ Effects • Air moves by ram and/or fan-induced pressure differentials • Fan operating point is determined by the vehicle speed and system resistance Ram Flow Characteristic Fan Operating Point
I: Low-Pressure Fans • ‘Low-Pressure’ fans develop more pressure at high flow rates. Wider effective operating range. • Suitable for truck and high-speed (Autobahn) applications. Performance Curves of LPF and HPF
II: Objectives • Develop correlations for blocked fan performance • Blockage plate effects on fan aerodynamics • Aerodynamic difference between HPF and LPF • Design constraints for an optimized LPF
III: Experimental DetailsTest Specimens • Siemens 487mm diameter fan • Airfoil shaped, back-swept blades, brushless DC motor, and a shroud incorporating a labyrinth seal and five structural support arms. Exploded Low-Pressure Fan Assembly
III: Blockage Measurements • Aim: • Quantify blockage induced pressure loss (δΨ) as a function of B • Apparatus: • AMCA Standard plenum chamber • Circular plate mounted downstream, Db=Df • Performance curves recorded for varying B • Data Reduction: • Pressure loss is calculated • A quadratic best fit curve is fit to the pressure loss • Coefficients of each curve are plotted as a function of Δ=B/Df
III: Plenum Chamber • Suction-type AMCA standard plenum chamber AMCA Standard 210-99 Plenum Chamber
III: LDV test, In-Situ Test Facility • Accommodates LDV measurements both upstream and downstream of the fan • Adjustable to simulate actual vehicle engine bay geometry Diagram of the In-Situ Chamber
III: Measurement Location • 0.006D downstream of the blade trailing edge • Traversing horizontally across one radius Measurement Location
IV: Data Analysis - Performance Curves LPF Performance HPF Performance
IV: Pressure Loss LPF Pressure Loss HPF Pressure Loss
IV: Pressure Loss vs. Df/B LPF Pressure Loss Coefficients vs. Df/B HPF Pressure Loss Coefficients vs. Df/B
IV: Correlation • A correlation between pressure loss and Δ=B/Df for both fans was developed: • HPF • LPF
IV: LDV Analysis • Axial Velocity: • Energy is redistributed as radial and tangential velocity • LPF tip flow maintained under blockage, allowing higher flow rates • Radial Velocity: • LPF encourages radial outflow • Alters streamlines over the blade (cylindrical to conical) • May lower airfoil lift
IV: Effective Chord Length Effective Chord Length – LPF
IV: Effective Chord Length Normal and Extended Blade Shape
V: Conclusions • Blockage Correlations • Developed expressions for pressure loss • Pressure loss becomes significant B=1/6Df • LDV Results: • Increased axial flow at tip due to blockage • Increased radial flow • Tip region produces zero flow without blockage (tip leakage) • Effective chord length leading to reduced camber and inaccurate Re numbers
VI: Future Work • Upstream measurements to confirm blade lift • Analysis of phase-averaged test results • Development of an integrated design methodology from these results • Prototype development and testing with assumption of conical stream surfaces
Acknowledgements • UWO Researchers • Rita Patel • MESc Candidate • James Kempston • Undergraduate Student • Graham Hunt • PhD Candidate • Jason Li • Former Post Doctoral Researcher • Siemens VDO Engineering Staff • Brian Havel, Mark Blissett, Paul McLennan • The Advanced Fluid Mechanics Research Group • www.eng.uwo.ca/research/afm