Download
1 / 45
450 likes | 659 Views
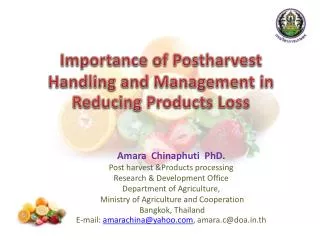
Postharvest Loss Prevention, ICT, and Innovation in Measurement. Steve Sonka, Director May 21, 2013. AGENDA. Future food security challenges Several “views” of postharvest loss The ADM Institute Themes Sustainable prevention of postharvest loss Innovation in measurement.

E N D
Postharvest Loss Prevention, ICT, and Innovation in Measurement Steve Sonka, Director May 21, 2013
AGENDA • Future food security challenges • Several “views” of postharvest loss • The ADM Institute • Themes • Sustainable prevention of postharvest loss • Innovation in measurement
Global Food Demand Is Predicted to Increase 70% by 2050 (FAO; 2009) Per capita food consumption
Global Crop Demand Is Estimated to Double From 2005 to 2050 (NAS; 2011)
2030 Food Demands Require About 200 Million More Hectares (McKinsey; 2011)
Commodity Price Changes Tell Interesting Story (McKinsey; 2011)
AGENDA • Future food security challenges • Several “views” of postharvest loss • The ADM Institute • Themes • Sustainable prevention of postharvest loss • Innovation in measurement X
PHL Varies by Region (FAO; 2011) DATA! Per capita food waste and food loss (Kg/year) Kg per year
PHL Varies Between States Within One Country (ADM Institute; 2012)
A More Specific Perspective:Rice in SE Asia (IRRI; 2011) In SE Asia, physical losses range from 15-25%. Quality losses range from 10-30% (loss in value) Crop Consumption
Reducing PHL and Increasing YieldsHave High Potential (McKinsey; 2011)
Little Attention Is Devoted to PHL and Yields (McKinsey; 2011)
Why Reduce Postharvest Loss?Some Hypotheses • Estimates suggest 1/3 of agricultural production is “wasted” and doesn’t reach food consumer • Investment required to reduce PHL could be modest • Technology advances should make reduction more feasible and less expensive • Arable land, water, energy are in limited supply – reducing PHL can lessen pressure on scarce resources
AGENDA • Future food security challenges • Several “views” of postharvest loss • The ADM Institute • Themes • Sustainable prevention of postharvest loss • Innovation in measurement X X
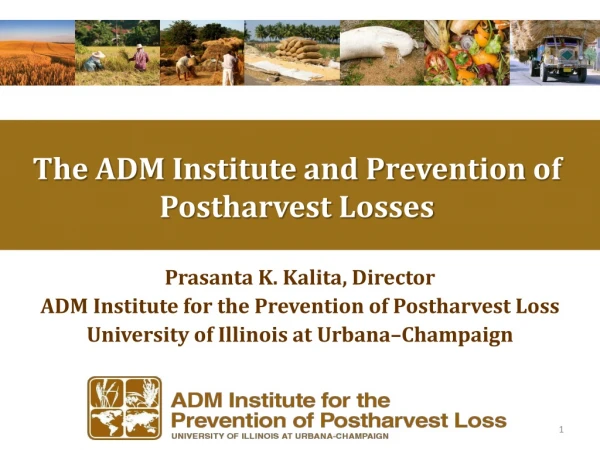
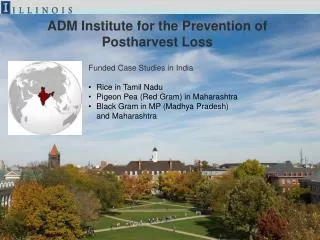
Timeline of the ADM Institute 2011 • Official Announcement • $10 million gift • India/Brazil emphasis • Staple crops
The ADM Institute • Vision Statement • Key elements include: • To be an international information and technology hub • To encompass technologies, practices and systems • To focus on staple crops in key agricultural domains
Timeline of the ADM Institute 2011 2012 • Official Announcement • $10 million gift • India/Brazil emphasis • Staple crops • Awareness & Collaboration • $2.5 million in funding allocated
Scientific Animations Without Borders (SAWBO) • Uses animations to disseminate information, particularly for low-literate populations • Images and audio to make information easily understood • Dissemination and access through internet, cell phones and tablets
Timeline of the ADM Institute 2011 2012 • Official Announcement • $10 million gift • India/Brazil emphasis • Staple crops • Awareness & Collaboration • $2.5 million in funding allocated 2013 Sustainable Prevention of Postharvest Loss
Sustainable Prevention of Postharvest Loss Cost of Reduction Value $s S 1/3rd of production is lost D Unsustainable Gap Reduced Loss (%) Current Setting 100 % Reduction
Sustainable Prevention of Postharvest Loss Cost of Reduction Value $s S S1 Measurement !!!!! D1 Enhanced Quality D Sustainable Gain Reduced Loss (%) Current Setting 100 % Reduction
Measurement “Another priority in the poorest countries must be to reduce the tragic waste of losses after harvest from inadequate storage, transportation and pest control.” “.. we urge …a goal of cutting in half these post harvest losses by 1985” Henry Kissinger. 7th special session of the U.N. General Assembly. September 1, 1975 Adopted as a resolution of the U.N. General Assembly. September 19, 1975 “What's measured improves” – Peter F. Drucker "Measurement is the first step that leads to control and eventually to improvement. If you can't measure something, you can't understand it. If you can't understand it, you can't control it. If you can't control it, you can't improve it." – H. James Harrington "What gets measured gets done, what gets measured and fed back gets done well, what gets rewarded gets repeated.“ – John E. Jones
Innovation in Measurement Whatto Measure • Actual loss in specific local settings • Interventions to reduce loss • Effectiveness of interventions over time Howto Measure • Low cost • Systemic • ICT enabled but probably for non PHL reasons
“Practice” to Date • Identify problem • Quantify (measure/estimate) losses • Identify causes • Propose technical solutions • Fund project to implement solutions Move to next project
Systems as Events/Patterns/Structure Patterns Structure The visible outcomes Events Changes over time Determines patterns
Knowledge-Creating Systems Tacit Explicit Documentation Observation Tacit Analysis Implementation Explicit
Phone Penetration Statistics 6.7 Billion mobile phones world-wide at the end of 2012 India in 2012 • 925 million mobile phone subscribers • 75% of the population • #2 Global Market (after China) Brazil in 2012 • 259 million mobile phone subscribers • 130% of the population • #5 Global Market (after China, India, US, and Indonesia) Nigeria in 2012 • 107 million mobile phone subscribers • 65% of the population • #10 Global Market Just under half of the population in India (i.e., more than 500 million people) use text messages on a regular basis
Tweets on Price of Rice (UN Global Pulse and Crime Hexagon; 2011)
Price of Bread in Uruguay (UN Global Pulse and PriceStats, 2011)
Address Source Dependency Social network helps ! Unconfirmed tweets Finding Gas in NYC after Hurricane Sandy
Community Knowledge Worker (Grameen Foundation, 2010) • Grameen Foundation is implementing an information network, Community Knowledge Worker (CKW), in Uganda, using mobile technology to delivery information to and from farmers. • CKW: an ICT enabled agricultural extension worker • Information to farmers: • Market price: 42 commodities in 20 districts • Weather information: Up to 3 days in advance • Farming best practices • Supplier directory • Market platform: link buyers and sellers • Mobile survey-based collection of farm data • Raw data • Analyses • GIS data
IRRI’s Approach on Measurement For sound medium and long term planning, what do we need to know? • Location specific, timely and accurate information on rice production, supplies, and trends • In particular: • What is the harvested area? • When will it be harvested? • What is the yield? A combination of remote sensing and crop yield modeling can provide this information under certain conditions
Optical Radar
Global rice monitoring and forecasting system:Radar-based real time crop monitoring system for rice Color shows crop establishment cyanlate Dec to early Jan bluemid-Jan red&greenstill under land preparation in mid-Jan • planting dates • rice area estimates • crop status & yield estimates • crop damage estimates • crop insurance Sentinel 1A & B satellites Global coverage every 6 days 20-m resolution Free
Open Data Definition “Open data is often referred to as the concept that information should be freely available to the public, without restriction or charge for its use by others. In the food and agricultural realm, open data is an essential piece of finding the answers we’ll need to feed the world.” (USDA, 2013) Actions • Launched The Food, Agriculture, and Rural “data community” on Data.gov • The Millennium Challenge Corporation released an open evaluation data catalog • Launched USAID.gov/Developer
Closing Comments • Society’s future food security – daunting but done before • Sustainable prevention of postharvest loss has potential to contribute to the challenge • Substantial progress unlikely without innovation in measurement • Low cost • Systemic • ICT enabled
Email: ssonka@illinois.eduWebsite: http://postharvestinstitute.illinois.edu