Download
1 / 16
160 likes | 297 Views
Analysis of Differential Gene Expression in a Myotonic Dystrophy Tissue Cultue Model. Matthew Tanner Berglund Lab, Institute of Molecular Biology CIS 407 Dec. 2 nd , 2013. Myotonic Dystrophy 1 (DM1). Symptoms

E N D
Analysis of Differential Gene Expression in a Myotonic Dystrophy Tissue Cultue Model Matthew Tanner Berglund Lab, Institute of Molecular Biology CIS 407 Dec. 2nd, 2013
Myotonic Dystrophy 1 (DM1) Symptoms Multisystemic – affects skeletal and smooth muscle (myotonia, atrophy), eyes (cataracts), heart, and endocrine system. Genetic Pathology DM1 caused by CTG trinucleotide repeat expansion in 3’ UTR of DMPK gene. Unaffected: less than 34 repeats DM1: 50 to >1000 repeats Severity of disease increases and age of onset decreases with increasing repeat length.
Potential for small molecules to alleviate molecular symptoms of DM1 Pentamidine Anti-fungal, anti-protozoan drug. Binds minor groove of DNA. Wilson et al., 2008. Coonrod, et al. (2013)
Tissue Culture Model and Experiment 24 hours after transfection: harvest whole-cell RNA. DMPK960 Transfect into HeLa cells. Drug 6 hours afterwards. DMPKminigene containing 960 CTG repeats. Induces DM1 disease state. Illuminahighthroughput sequencing library preparation (several steps) IlluminaHi-Seq 2000 massively parallel sequencer
RNA-Seq Library Preparation Pease & Sooknanan, 2012.
Illumina Raw Output Four lines for each sequence: Coordinates of read Sequence + ASCII quality score for each base call (Phred-33)
Alignment and Analysis with Tuxedo Suite Tophat 2.0 – align FASTQ reads that were cleaned up with Stacks’ process_shortreads to human genome. Pass $SAMPLE variable in at command line: qsub tophat.sh –N align0A –V SAMPLE=“0A”
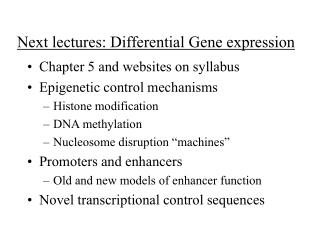
Alignment and Analysis with Tuxedo Suite Tophat 2.0 – align FASTQ reads that were cleaned up with Stacks’ process_shortreads to human genome. Cufflinks – take mapped reads (accepted_hits.bam) and generate transcript model of reads. Cuffmerge – take individual transcript models (transcripts.gtf)and merge into master transcriptome. Cuffdiff– take mapped reads from individual treatments (accepted_hits.bam)and, with aid of master transcriptome, compare each sample pair-wise. Take various Cuffdiff output files (differential gene expression, splicing, promoter usage, isoforms, etc.) and analyze with original scripts or explore with existing programs.
Visualization of differential gene expression log10 (FPKM + 1) of genes at each dosage that are associated the p53 network. FPKM: fragments per kilobase of exon model per million mapped fragments
none low med high Visualization of differential gene expression log10 (FPKM + 1) of genes at each dosage that are associated with the gene ontology “Regulation of RNA splicing” (GO:0043484)
How about all the (significantly differentially expressed) genes? What are these genes? log2(foldchange) of 1210 genes with q < 0.05 between none and low pentamidine dosage
A closer look none low med high
Next steps? • Analyze this and other clustered subsets by: • Sequence analysis (motifs) • GC/AT content • Gene ontology enrichment