Introduction to Bioinformatics Microarrays1: Microarray Technology
Introduction to Bioinformatics Microarrays1: Microarray Technology. Course 341 Department of Computing Imperial College, London Moustafa Ghanem. Aims for the 2 nd part of Course Microarray Bioinformatics. Appreciate the bigger picture of bioinformatics


Introduction to Bioinformatics Microarrays1: Microarray Technology
E N D
Presentation Transcript
Introduction to BioinformaticsMicroarrays1: Microarray Technology Course 341 Department of Computing Imperial College, London Moustafa Ghanem
Aims for the 2nd part of CourseMicroarray Bioinformatics • Appreciate the bigger picture of bioinformatics • Bioinformatics is more than nucleotide sequence analysis • Functional Genomics and Drug Discovery • Understand basic microarray technology and its use in gene expression analysis. • Learn basic data analysis methods and how to apply them in the analysis of gene expression data • Data Clustering • Data Classification • Statistical Analysis
Recommended Texts • For this part of the course • Lecture Notes • Handouts • General overview of microarray data analysis • “Microarray Gene Expression Data Analysis: A Beginner’s Guide” (Causton, Quakenbush and Brazma) • “Microarray Bioinformatics” (Stekel) • Data Mining • “Data Mining: Concepts and Techniques” (Han)
Microarray TechnologyLecture Overview • Aims, Motivation and Overview of 2nd Part of Course • Biology Background • Basic Idea of Microarrays • Types of Microarray technologies and how they work • Outputs of Microarrays • Image Analysis required to transform output to gene expression matrices • Generating Gene Expression Matrices
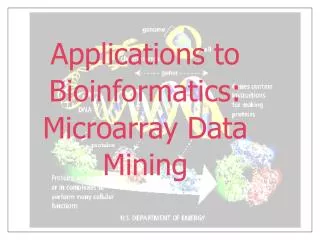
BackgroundFunctional Genomics • Functional Genomics: • Systematic analysis of gene activity in healthy and diseased tissues. • The study of obtaining an overall picture of genome functions, including the expression profiles at the mRNA level and the protein level. • Functional Genome Analysis: • used to understand the functionsof genes and proteinsin an organism. This is typically known as genome annotation. • used in integrative biology and systems biology studies aiming to understand health and disease states (e.g. cancer, obesity, …etc) • Used as an important step in the search for new target molecules in the drug discovery process.
Pre-clinical Trials Target Identification Target Validation LeadIdentification LeadOptimization clinical Trials BackgroundThe Drug Discovery Pipeline • Drug Discovery is a lengthy process that takes years and requires the use of bioinformatics, chemoinformatics and clinical-informatics tools. • Functional genomics plays an important role in speeding up the pipeline and also in allowing us to try new therapeutic methods.
BackgroundDrug Discovery • Functional genomics plays an important role in identifying functions of potential therapeutic targets such as encoded proteins. Gene expression studies plays an important role in most stages: • Target Identification: • Understand disease states, identify genetics changes that cause disease (genes, proteins, tissues, environmental conditions, etc) • Target Validation: • Understand the role of a target and the effects of manipulating a target candidate (e.g. what if I knock a gene out) • Compound Screening: • Understand compound’s effect on target and its risk profile • Pre-clinical and clinical trials: • Prioritise studies
Nucleus Cell Chromosome Gene (DNA) Gene (mRNA), single strand Protein BackgroundBiology, Cells and DNA • All living organisms consist of cells. Humans have trillions of cells; Yeast - one cell. • Cells are of many different types (blood, skin, nerve), but all arose from a single cell (the fertilized egg) • Each cell contains a complete copy of the genome (the program for making the organism), encoded in DNA. • A gene is a segment of DNA that specifies how to make a protein. Human DNA has about 30-35,000 genes; Rice has about 50-60,000, but shorter genes.
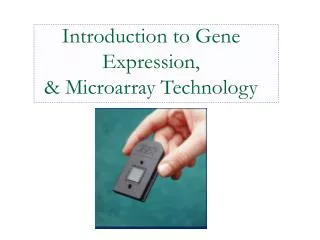
DNA sequence (split into genes) codes for Amino Acid Sequence has Protein folds into 3D Structure Protein Function determines dictates Cell Activity What is…? • Gene Expression: • The process by which the information encoded in a gene is converted into an observable phenotype (most commonly production of a protein). • The degree to which a gene is active in a certain tissue of the body, measured by the amount of mRNA in the tissue. • Microarrays: • Tools used to measure the presence and abundance of gene expression in tissue. • microarray technologies provide a powerful tool by which the expression patterns of thousands of genes can be monitored simultaneously
BackgroundGene Expression • Cells are different because of differential gene expression. • About 40% of human genes are expressed at one time. • Gene is expressed by transcribing DNA into single-stranded mRNA • mRNA is later translated into a protein • Microarrays measure the level of mRNA expression
Metabolites RNA A Dynamic ViewGene expression depends on environment! Interactions Environment DNA Protein Growth rate Expression
forwards-propagated correlations metabolites protein mRNA time event A Dynamic ViewGene expression varies with time !
Microarray TechnologyQuantitative Measurement of Gene Expression • Also known as DNA microarrays, DNA arrays, DNA chips, gene chips, … Whatever the name, their use is effectively transforming a living from a black box into a transparent box.
Data Analysis over microarray data • What type of data analysis is required to: • Identify Genes expressed in different cell types (e.g. Liver vs finger) • Learn how expression levels change in different developmental stages (embryo vs. adult) • Learn how expression levels change in different developmental stages (cancerous vs non-cancerous) • Learn how groups of genes inter-relate (gene-gene interactions) • Identify cellular processes that genes participate in (structure, repair, metabolism, replication, … etc) • Applications covered only as example contexts, emphasis is on analysis methods
Affymetrix Inc. is the leading provider of Microarray technology (GeneChip®) http://www.affymetrix.com/ MicroarraysBasic Idea • A Microarray is a device that detects the presence and abundance of labelled nucleic acids in a biological sample. • In the majority of experiments, the labelled nucleic acids are derived from the mRNA of a sample or tissue. • The Microarray consists of a solid surface onto which known DNA molecules have been chemically bonded at special locations. • Each array location is typically known as a probe and contains many replicates of the same molecule. • The molecules in each array location are carefully chosen so as to hybridise only with mRNA molecules corresponding to a single gene.
Several companies sell equipment to make DNA chips, including spotters to deposit the DNA on the surface and scanners to detect the fluorescent or radioactive signals. Basic Idea • A Microarray works by exploiting the ability of a given mRNA molecule to bind specifically to, or hybridize to, the DNA template from which it originated. • By using an array containing many DNA samples, scientists can determine, in a single experiment, the expression levels of hundreds or thousands of genes within a cell by measuring the amount of mRNA bound to each site on the array. • With the aid of a computer, the amount of mRNA bound to the spots on the Microarray is precisely measured, generating a profile of gene expression in the cell.
BackgroundDNA/RNA Hybridization • DNA molecules: • DNA molecules are long double-stranded chains; 4 types of bases are attached to the backbone: adenine (A), guanine (G), cytosine (C), and thymine (T). A pairs with T, C with G. • DNA-RNA hybridization: • When a mixture of DNA and RNA is heated to denaturation temperatures to form single strands and then cooled, RNA can hybridize (form a double helix) with DNA that has a complementary nucleotide sequence.
The technology for making DNA chips has become so well-defined that it is even possible to construct all of the equipment for under $50,000 using directions on the Internet from Professor Pat Brown’s laboratory at Stanford. http://cmgm.stanford.edu/pbrown/ The Array
Applying a Labelled Sample • The molecules in the target biological sample are labelled using a fluorescent dye before sample is applied to array • If a gene is expressed in the sample, the corresponding mRNA hybridises with the molecules on a given probe (array location). • If a gene is not expressed, no hybridisation occurs on the corresponding probe. • Reading the array output • After the sample is applied, a laser light source is applied to the array. • The fluorescent label enables the detection of which probes have hybridised (presence) via the light emitted from the probe. • If gene is highly expressed, more mRNA exists and thus more mRNA hybridises to the probe molecules (abundance) via the intensity of the light emitted.
Labelled targets in solution Heteroduplexes Probes on array Hybridisation Chemistry Basics: Surface Chemistry is used to attach the probe molecules to the glass substrate. Chemical reactions are used to attach the florescent dyes to the target molecules Probe and Target hybridise to form a double helix The Process
Steps of a Microarray Experiment • Prepare DNA chip(s) by choosing probes and attaching them to glass substrate. Note location and properties of each probe. • Generate a hybridization solution containing a mixture of fluorescently labelled targets. • Incubate hybridization mixture. • Detect probe hybridization using laser technology • Scan the arrays and store output as images • Quantify each spot • Subtract background • Normalize • Export a table of fluorescent intensities for each gene in the array • Analyze data using computational methods.
Types of Microarrays • How are Microarrays are made? • What molecules make the probes? • cDNA (PCR products) vs Oligos • How are the probes added to the chip? • Spotting vs. In-situ synthesis • Output type • Single label vs. Dual label • Why ? Appreciation of some of the concepts of the technology. • Helps us understand and choose between available technology. • Helps us design our experiments. • Helps understand sources of errors in array outputs and compensate for them.
Each probe represents the measurement for a single gene An array represents measurements for many genes Designing the Probes • The probes need to be of high specificity to avoid hybridization with wrong target molecules. • The probes need to generate an output that is easy to read (spots lie in defined positions and be of regular size and shape and even spacing). • The probes have to have high sensitivity to detect the mRNA and the intensity of the spot light must be differentiable from background noise. • The intensity of a spot light also needs to correlate with the abundance of the target molecule in the sample. • Results must be reproducible across multiple experiments.
Different chip manufacturers use different technologies As an end user you will use the probe types recommended for the chips, but would have to select the sequences for the probes to be used in your experiments Affymetrix technology is based on oligos (20 bases per probe) Probe Types • The DNA probes used on a an array can either be polymerase chain reaction (PCR) products (cDNAs) or Oligonucleotides. • In the first case (cDNA), highly parallel PCR is used to amplify DNA from a clone library, and the amplified DNA is purified, the clones are typically long sequences (Complete genes or ESTs). • In the second case, DNA oligonucleotides are presynthesised for use on the array --- An oligonucleotide, or oligo as it is commonly called, is a short fragment of a single-stranded DNA that is typically 5 to 50 nucleotides long. This can achieve a higher density of probes per chip. • In both cases the probes are attached (fixed or immobilized) to a glass (or nylon) surface using special surface chemical techniques (Beyond this course).
Spotting vs. In-situ SynthesisSpotting • Spotting works for both cDNA probes and oligo probes • The Spotting Process • The DNA probes are produced and stored in wells. • A Spotting robot is used to deposit them onto individual locations on the glass slide • The glass slide is post-processed so no further DNA can attach to it. • Spotting is easy to automate but may generate poor quality spots (irregular spots of different shapes and sizes)
The Spotting Robot • The Operation of the Spotting Robot • The pins are dipped into the wells to collect the first batch of DNA. • This DNA is spotted onto a number of different arrays, depending on the number of arrays being made and the amount of liquid the pins can hold. • The pins are washed to remove any residual solution and ensure no contamination of the next sample. • The pins are dipped into the next set of wells. • Return to step 2 and repeat until the array is complete.
Affymetrix technology is based on in-situ synthesis in a series of addition steps separated by mask addition and then photo-deprotection. Spotting vs. In-situ SynthesisIn-situ Synthesis • Since oligos are synthesized short sequences, their bases can be added to the glass surface one at a time. • Using high tech processes this can generate best quality (regular even spots). • Different patented technologies are used to enable this to happen while not allowing more than one base to be added at a time, including • Photodeprotection technology (Affymetrix) • Inkjet Array Synthesis
Many other variations of the technology exist, such as the use of longer oligos, the use of fibre optics, etc. Comparison of Probe Types In-situ Synthesis / Oligos PCR Products / cDNA Probes • Advantages • Flexibility to study cDNAs from any source. • cDNAs do not require any a priori information about the corresponding genes. • Longer sequences increase hybridization specificity, which reduces false positives. • Advantages • No need to isolate and purify cDNAs because oligonucleotides can be synthesized. • Short oligonucleotides are less likely to have cross-reactivity with other sequences in the target DNA. • Density of chips is higher than with cDNAs. • Limitations • Isolation of individual cDNAs to immobilize on each spot can be cumbersome. • Density is lower than synthesizing oligonucleotides on the surface of the chip. • cDNAs are longer sequences and are more likely to randomly contain sequences found in target DNA, which results in cross-reactivity. • Limitations • The sequence has to be known. • Synthesis can be expensive and time-consuming. • The short sequences are not as specific for target DNA, so appropriate controls must be added.
Affymetrix technology is based on the use of single labels Single Label vs. Dual LabelSingle Channel vs Dual Channel • Most laboratories use fluorescent labelling, with the two dyes Cy3 (excited by a green laser) and Cy5 (excited by a red laser). • In Dual label experiments, two samples are hybridised to the arrays, one labelled with each dye; this allows the simultaneous measurement of two samples (e.g. for differential analysis) • In Single label experiments, only one sample is hybridised to the arrays labelled with one dye. (in which case control needs to be measured using a separate chip). • Choice between single and dual label is governed by array technology and underlying chemistry.
+ Red label + Green label RNA sample 2 RNA sample 1 Slide Dual Label Experiments Typically used in custom made cDNA chips Typically used to study one sample (e.g. diseased tissue) vs. a control sample (e.g. normal tissue) Separate images are obtained for each channel, and then combined
Qualitative Interpretation of Double Label Experiments • GREEN represents High Control hybridization RED represents High Sample hybridization YELLOW represents acombination of Control and Sample where both hybridized equally.BLACK represents areas where neither the Control nor Sample hybridized. • Main issue is to quantify the results: • How green is green? • What is the ratio of the signal to background noise? • How to compare multiple experiments using different chips? • How to quantify cross hybridization (if any)?
Affymetrix GeneChipExample of Single Label Chips • Hundreds of thousands of oligonucleotide probes packed at extremely high densities. The probes designed to maximize sensitivity, specificity, and reproducibility, allowing consistent discrimination between specific and background signals, and between closely related target sequences. • RNA labeled and scanned in a single “color” one sample per chip
Interpreting Affymetrix OutputPerfect Match/Mismatch Strategy • GeneChips use a Perfect Match/Mismatch probe strategy • Each probe designed to be perfectly complementary to a target sequence, a partner probe is generated that is identical except for a single base mismatch in its centre. • These probe pairs, called the Perfect Match probe (PM) and the Mismatch probe (MM), allow the quantitation and subtraction of signals caused by non-specific cross-hybridization. • The difference in hybridization signals between the partners, as well as their intensity ratios, serve as indicators of specific target abundance.
PM to maximize hybridization MMto ascertain the degree of cross-hybridization Affymetrix GeneChipsPerfect Matches and Mismatches
Typical Problems of Raw Output Uneven grid positions Curves within a grid Variable Spot size or shape Variable Distance between spots Other Image Processing Problems Spot Quality Problems Various Image processing techniques may be applied to read and interpret the outputs of Microarrays Commercial Microarray (e.g. Affymetrix) systems use proprietary software Image Analysis software packages exist for the analysis of the output of custom made chips (e.g. GenePix Pro, Array Vision, TIGR Spot Finder, etc)
Finaldata Gene Expression Matrix Rawdata Intermediatedata Array scans Images Samples Genes Spots Gene expression levels Spot/Image quantiations From Microarray images to Gene Expression Matrices
From Microarray images to Gene Expression Matrices • In spot quantitation matrices, rows typically represent all the measurements made from individual spots on the array. These can include mean and median pixel intensities of the spot and local background, etc. • An experiment typically consists of one or more spot quantitation matrices representing all arrays used in the study. • In the gene expression matrix, rows represent genes (as opposed to features/spots on the array) and columns represent measurements from different experimental conditions measured on individual arrays. • An example is each column representing measurements at different time points (to, t1, t2, …) in time course experiments • A second example is each column representing different tissue type • A third is each column representing a different individual • A fourth is having groups of columns representing measurements from diseased cells, and other groups representing measurements from health cells, • etc, • Each of the above matrices requires the application of data normalisation technuiques as discussed in the next lecture.
SummaryMicroarrays • Basic Concept • Based on Crick-Watson Hybridization • Different Microarray technologies exist. • Probe type (cDNA vs oligo) • Spotting vs in-situ synthesis • Single vs. dual channel • Output is a typically an image • Sources of errors • Image processing is required • Images are converted into gene expression matrices for further analysis