Download
1 / 2
20 likes | 97 Views
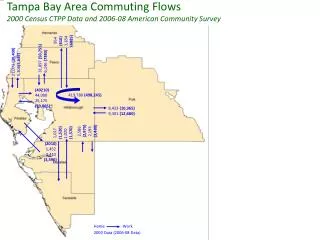
Explore commuting patterns in the Tampa Bay area using 2000 Census and 2006-08 ACS data to analyze home-to-work statistics and changes over time. Gain insights into transportation trends.

E N D
Tampa Bay Area Commuting Flows 2000 Census CTPP Data and 2006-08 American Community Survey 954 (610) 3,654 (6985) 31,897 (50,755) 6,146 (7380) 21,073 (30,400) 5,306(5,645) (40210) 44,000 25,175 (29,805) 419,780(498,245) 8,423 (10,365) 9,301 (12,680) 2,586 (2,975) 2,193 (3,480) 1,017 (1,520) 1,020 (1,370) (2010) 1,452 2,410 (3,590) Home Work 2000 Data (2006-08 Data)