Model features, structure, operation
Hybrid v3.0 is a numerical process-based model of terrestrial ecosystem dynamics, predicting the cycling of C, N, and water within the biosphere. The model includes generalized plant types, parameters, and simulations that assess carbon status and sensitivity analysis.

Model features, structure, operation
E N D
Presentation Transcript
A process-based, terrestrial biosphere model of ecosystem dynamics (Hybrid v. 3.0)A. D. Friend, A.K. Stevens, R.G. Knox, M.G.R. Cannell. Ecological Modelling 95 (1997) 249-287.Presented by Dahl WintersGeog 595, April 17, 2007
Model features, structure, operation Hybrid v3.0 is a numerical process-based model of terrestrial ecosystem dynamics, driven by daily weather. Treats the daily cycling of C, N, and water within the biosphere, and between the biosphere and atmosphere. Combines a mass-balance approach with the capacity to predict the relative dominance of different species or generalized plant types.
Model features, structure, operation The main processes represented in the model:
Model features, structure, operation Parameters specific to each generalized plant type (GPT):
Model features, structure, operation Model parameters that apply to all GPTs:
Model features, structure, operation Model parameters that apply to all GPTs:
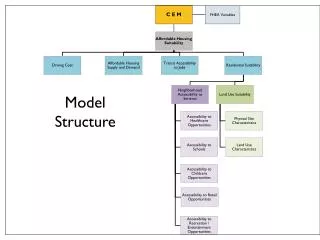
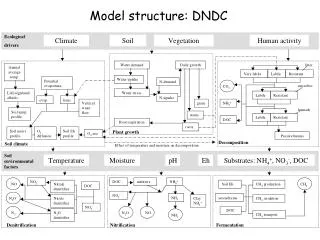
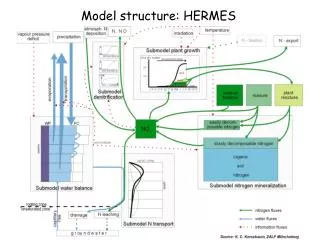
Model features, structure, operation Flow diagram shows the main flows of C, N, and water in a plot. Diagram broadly divided into atmospheric, canopy, and soil components. Boxes = state variables Shaded boxes = C and N pools Square brackets = SOM pools Microbial pools divided into surface and below-ground components
Model features, structure, operation Linkages represented in the model:
Simulations • Three simulations done, each time run for 500 years over 10 plots in SW Pennsylvania - temperate climate, moist in all seasons, hot summer, deciduous oak-hickory forest. • Simulation 1: predicts mean NPP and biomass carbon during the last 100 simulated years. • Simulation 2: Shows that non-autonomous mortality causes reductions in productivity and LAI, with NPP reduced by 32%. • Simulation 3: NPP and LAI are hardly affected by the increased mortality. However, death of large trees occurred in most plots, which is more realistic than Simulation I.
Sensitivity Analysis • Simulation III conditions used. Model output taken to be the 5 parameters considered most important for the ecosystem’s overall carbon status: GPP, NPP, LAI, Cv, and Cs. • Sensitivity index of 1: the 5 output parameters change by an average of 10% for a 10% change in the tested parameter or constant. Higher value = more than linear effect; smaller value = less than linear effect.
Sensitivity Analysis • Most important parameter: autumn daylength for leaf fall. An increase of 10% = 28-day reduction in growing season length. • Daylength also important; reflects the importance of the balance of the photosynthetic and respiratory processes. • The next few parameters reflect the dominance of the photosynthetic rate in determining the amount of carbon in the system. • Nitrogen uptake coefficient has a much lower sensitivity index – reflects the fact that nitrogen mineralization is fast enough in the warm climate to keep pace with the supply of carbon through photosynthesis.
Sensitivity Analysis • Latitude important because it affects both daylength and phenology. • Ratios of carbon and nitrogen between the foliage and fine roots are also important. • Many clearly unimportant parameters for the overall carbon balance of the modeled ecosystem – model simplification may be possible, but only for this ecosystem. • Low sensitivity values occurred for the hydrological parameters due to absence of water stress, which might not be the case in more arid ecosystems.
Discussion • Hybrid v3.0 meets the 3 requirements: • 1) full coupling of the carbon, nutrient, and water cycles in the soil-plant-atmosphere system, • 2) the only external constraint on model behavior is climate, and • 3) the model represents the growth and development of vegetation over time, and so can predict transient responses to climate. • The model is useful for examining the effects of vegetation on the global climate and vice-versa.
Discussion • Model validation should be done, but due to its mechanistic nature, fitting the model to data is highly subjective and not very meaningful. • Better yet, test and improve the model’s ability to meet the 3 performance criteria. Hybrid v3.0 has only climate as its variable input, so it can be rigorously tested by comparing its predictions with present-day conditions. • Possible tests: • 1) Prediction of present day water and carbon fluxes measured at different locations, • 2) Geographic distributions of vegetation types on global and regional scales, • 3) Amounts of carbon in different locations.
Conclusion A model that is able to predict present-day conditions across a range of climates with climate as the sole input variable, can be used with some confidence to predict the impacts of global change. With further tests and refinement, Hybrid v3.0 has the potential to become such a model.