Download
1 / 52
520 likes | 547 Views
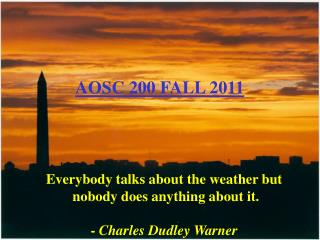
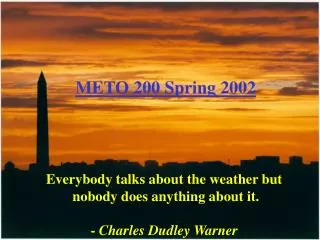
AOSC 200 SUMMER 2010. Everybody talks about the weather but nobody does anything about it. - Charles Dudley Warner. AOSC 200 Weather and Climate Lecture Time and Location: Monday through Friday- 9:00 am to 11.30 am CSS 2416 Discussion Time and Location

E N D
AOSC 200 SUMMER 2010 Everybody talks about the weather but nobody does anything about it. - Charles Dudley Warner
AOSC 200 Weather and Climate Lecture Time and Location: Monday through Friday- 9:00 am to 11.30 am CSS 2416 Discussion Time and Location Monday through Friday - 1.00 pm to 3.00 pm, CSS 3426 Textbook: Meteorology: Understanding the Atmosphere, by Ackerman and Knox
AOSC 200 Weather and Climate • Course website www.atmos.umd.edu/~hudson/aosc200.d • Contains: • Each lecture in Power-point format on web page. Go to AOSC200 LECTURES Syllabus and class schedule • All class information will be posted on the website. • A weather forecasting primer can be found at www.atmos.umd.edu/~hudson/forecastchecklist-2010.htm
Grading • The course will be graded on the basis of a mid-term exams (25% of the final grade) , a final exam(30% of the final grade), 7 lab projects (25% of the final grade), and 4 quizzes (20% of the final grade).
Who am I? • My PhD was in Physics. My research thesis was in Spectroscopy. Each molecule or atom emits and absorbs radiation in unique regions – like a finger print. One can use this fact to identify the molecule or atom. • Before joining UM in 1990, I worked for NASA developing instruments to identify atmospheric molecules from satellites. • It was at NASA that I became an atmospheric physicist • Research on the Ozone layer in the Stratosphere. • Current research is on applying this ozone data to climate studies.
http://www.youtube.com/watch?v=YfcNRWefEEUhttp://www.youtube.com/watch?v=YfcNRWefEEUhttp://www.youtube.com/watch?v=YfcNRWefEEUhttp://www.youtube.com/watch?v=YfcNRWefEEU
http://www.youtube.com/watch?v=KRdi5ElayK4http://www.youtube.com/watch?v=KRdi5ElayK4http://www.youtube.com/watch?v=KRdi5ElayK4http://www.youtube.com/watch?v=KRdi5ElayK4
Weather Satellite Image, July 7, 2005 Fig. 1-1, p. 2
Weather Instantaneous description of what the atmosphere is doing at a particular time and place Climate Description of what weather is usually like in a region (large or small). Not just the average weather, but a description of what the extremes are like too. Weather vs. Climate
Different hemispheres – different weather Why? Different ratios of land to oceans. Oceans tend to act like a thermostat. Mountains cause instabilities in the air flow. Southern hemisphere is calmer. Fig. 1-2, p. 3
Mean Percentage of possible sunshine for November Typical Weather Map Typical Climatology Map
FRONTS • You will often hear TV meteorologists refer to cold and warm fronts when describing the weather. • Fronts are regions where cold and warm air masses meet. • This is the region where most of the ‘weather’ is generated. • We identifiy four main classes of fronts, warm, cold, stationary, occluded. • Each front has an unique symbol on weather maps.
Warm Front Fig. 9.13
Cold front Fig. 9.15
Weather Symbols Fig. 1-17, p. 21
Detailed weather symbols (1) Direction of arrow into the circle gives the wind direction. Number of barbs on the arrow gives the wind speed. Full barb = 10 miles per hour, half barb=5. (2) Sign, middle left, gives the type of precipitation. In the top left symbol the sign is fot thunder. In the bottom left it stands for steady rain. (3) Shading in inner circle gives the cloud fraction. (4) Top number on left is the temperature, bottom number the dew point
Weather symbols • The numbers at top right of each symbol represent the pressure in millibars (mb) • The pressure seldom drops below 950 mb and seldom gets above 1049 mb • In the days of teletype the object was to shorten the amount of information sent. • So if I say the pressure was 98 then the receiver could assume that I meant 998. And if I sent 14 then 1014 was assumed. • To further confuse the issue it was decided to sent the tenth of a mb. So now if I sent 998 I meant 999.8. Similarly 117 means 1011.7.
Weather Forecasting • A website has been prepared to guide you through the process of making a simple weather forecast. • You can either go to Dr. Hudson’s web page and then click on: Forecast Checklist • Or go to: http://www.atmos.umd.edu/~hudson/forecastchechecklist-2010.htm
Composition of the Earth’s Troposphere H2 PM O2 CH4 N2 CO N2O O3 ←SO2, NO2, CFC’s, etc Ar CO2 Inert gases
Atmospheric Composition • MOLECULAR OXYGEN AND NITROGEN ARE MAJOR COMPONENTS – 99% • OF THE REMAINING 3% , 97% IS THE INERT GAS ARGON • OF THE REMAINING 7%, 93% IS CARBON DIOXIDE • ALL REMAINING GASES – ABOUT 2 PARTS IN 100,000 ARE KNOWN AS TRACE SPECIES • THESE GASES CONTROL THE CHEMISTRY OF THE TROPOSPHERE
Atmospheric Evolution • Earth’s early atmosphere consisted of Hydrogen (H), Helium (He), Methane (CH4) and Ammonia (NH3) • As the earth cooled volcanic eruptions occurred emitting water vapor (H2O), carbon dioxide (CO2) and molecular nitrogen (N2). • The molecular oxygen (O2) in the current atmosphere came about as single celled algae developed in the oceans about 3 billion years ago. • The oxygen is produced as a by-product of photosynthesis, the making of sugars from water vapor and carbon dioxide. • This oxygen produced ozone in the upper atmosphere which filtered out harmful ultraviolet radiation from the sun. This allowed plants and animals to develop on land.
Carbon Dioxide Cycle • SOURCES • VOLCANOES • PLANT/ANIMAL RESPIRATION • PLANT DECAY • BURNING OF FOSSIL FUELS • DEFORESTATION • SINKS • PLANT PHOTOSYNTHESIS • OCEANS • CARBONATES
HydrologicCycle Fig. 1-5, p. 8
Hydrologic Cycle • WATER IS EVERYWHERE ON EARTH • IT IS IN THE OCEANS, GLACIERS, RIVERS, LAKES, THE ATMOSPHERE, SOIL, AND IN LIVING TISSUE • ALL OT THESE ‘RESERVOIRS’ CONSTITUTE THE HYDROSPHERE • THE CONTINUOUS EXCHANGE OF WATER AMONGST THE ‘RESERVOIRS’ IS KNOWN AS THE HYDROLOGIC CYCLE • THE HYDROLOGIC CYCLE IS POWERED BY ENERGY FROM THE SUN • EVAPORATION AND TRANSPIRATION • PRECIPITATION • RUN-OFF TO THE SEA
Other important Gases • Methane - CH4 • Is produced wheneverplant material decays below water, e.g. in marshes and rice paddies. • Is a greenhouse gas. Has a long lifetime in the Troposphere but breaks down in the Stratosphere to form water. • Cholofluorocarbons - scientific name for the Freons. • Are greenhouse gases • Have a long lifetime in the Troposphere but break down in the Stratosphere to releases chlorine. Responsible for the Ozone Hole. • Emissions were banned as a result of the Montreal Protocol.
Aerosols • PARTICLES SUSPENDED IN THE ATMOSPHERE • DIAMETERS MEASURED IN MICRONS – ONE MILLIONTH OF A METER. • CAN MODIFY THE AMOUNT OF SOLAR ENERGY THAT REACHES THE SURFACE. • CAN ACT AS CONDENSATION NUCLEI FOR CLOUD DROPLETS. • PRIMARY SOURCES: • SEA SALT SPRAY • WIND EROSION • VOLCANOES • FIRES • HUMAN ACTIVITY
Smoke from Forest Fires along the coast of California. Fig. 1-11, p. 12
Smoke from Forest Fire in New Mexico Fig. 1.11
Toricello • Filled a glass tube with mercury that had been sealed at one end • He then inverted the tube in a bowl of mercury • Found that the mercury did not flow out of the tube but remained in the tube, and that the height of the mercury column was constant each time he tried the experiment. • He reasoned that the air was keeping the mercury in the column by pressing down on the bowl of mercury.
Atmospheric Pressure • PRESSURE AT A POINT IS THE WEIGHT OF AIR ABOVE THAT POINT • A COLUMN OF AIR AT THE SURFACE WEIGHS SLIGHTLY MORE THAN 1 KILOGRAM PER SQUARE CENTIMETER • IN STILL AIR, TWO FACTORS DETERMINE THE PRESSURE – TEMPERATURE AND DENSITY • IDEAL GAS LAW • PRESSURE = DENSITY.TIMES.TEMPERATURE.TIMES.CONSTANT • PRESSURE CHANGES WITH ALTITUDE