Predictive Analysis in Software Development: Concepts and Methods
Explore the scope of prediction in software development, from resources to change impact. Learn about building prediction models, common SE predictions, and related work. Use metrics for fault prediction and improve process performance.


Predictive Analysis in Software Development: Concepts and Methods
E N D
Presentation Transcript
Prediction Basic concepts
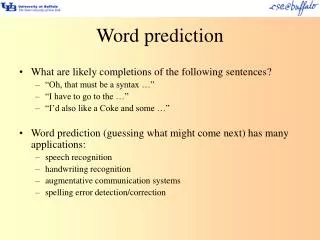
Scope Prediction of: • Resources • Calendar time • Quality (or lack of quality) • Change impact • Process performance • Often confounded with the decision process
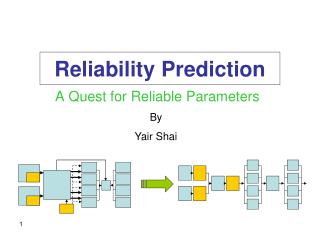
Historical data Y (dependent, observed, response variable) explained variance of observed Yi prediction interval of new observation Y0 at x0 x0 X (independent, prediction variable) known unknown
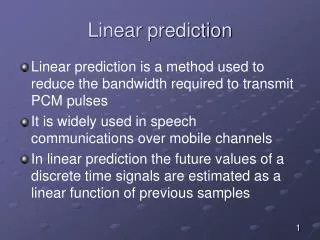
Methods for building prediction models • Statistical • Parametric • Make assumptions about distribution of the variables • Good tools for automation • Linear regression, Variance analysis, ... • Non-parametric, robust • No assumptions about distribution • Less powerful, low degree of automation • Rank-sum methods, Pareto diagrams, ... • Causal models • Link elements with semantic links or numerical equations • Simulation models, connectionism models, genetic models, ... • Judgemental • Organise human expertise • Delphi method, pair-wise comparison, rule-based methods
Common SE-predictions • Detecting fault-prone modules • Project effort estimation • Change Impact Analysis • Ripple effect analysis • Process improvement models • Model checking • Consistency checking
Introduction • There are many faults in software • Faults are costly to find and repair • The later we find faults the more costly they are • We want to find faults early • We want to have automated ways of finding faults • Our approach • Automatic measurements on models • Use metrics to predict fault-prone modules
Related work • Niclas Ohlsson, PhD work 1993 • AXE, fault prediction, introduced Pareto diagrams, • Predictor: number of new and changed signals • Lionel Briand, Khaled El Eman, et al • Numerous contributions in exploring relations between fault-proness and object-oriented metrics • Piotr Tomaszewski, PhD Karlskrona 2006 • Studies fault density • Comparison of statistical methods and expert judgement • Jeanette Heidenberg, Andreas Nåls • Discover weak design and propose changes
Approach • Find metrics (independent variables) • Number of model elements (size) • Number of changed methods (change) • Transitions per state (complexity) • Changed operations * transitions per state (combinations) • ... • Use metrics to predict (dependent variable) • Number of TRs
Data model package capsule class port protocol attribute operation State machine signal State transition
Our project - modelmet • RNC application - Three releases • About 7000 model elements • TR statistics database (2000 TRs) • Find metrics • Existing metrics (done at standard daily build) • Run scripts on models • Statistical analysis • Linear regression, principal component analysis, discriminant analysis, robust methods • Neural networks, Bayesian belief networks
Size Change Complexity Combined
Other metrics, system A 0.034 states – 0.965 protocols TRD = C + modelelements
How to use predictions • Uneven distribution of faults is common – 80/20 rule • Perform special treatment on selected parts • Select experienced designers • Provide good working conditions • Parallell teams • Inspections • Static and dynamic analysis tools • ... • Perform root-cause analysis and make corrections
Results Contributions: • Valid statistical material: • Large models, large number of TRs • Two change projects • Two highly explanatory predictors were found • State chart metrics are as good as OO metrics Problems: • Some problems to match modules in models and TRs • Effort to collect change data