Download
1 / 28
280 likes | 366 Views
Explore the collaborative aspects of visual sensemaking through the NameVoyager application, focusing on social interaction and usability. Learn about the study design, findings, and future directions for enhancing group engagement in visual exploration.

E N D
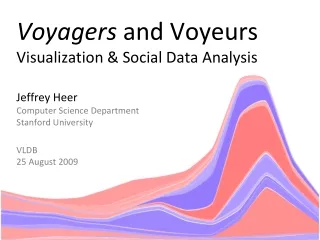
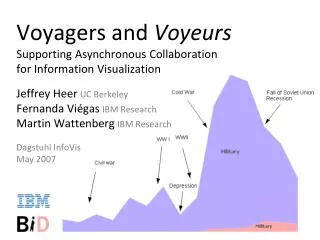
Voyagers and VoyeursSupporting Asynchronous Collaborationfor Information Visualization Jeffrey HeerUC Berkeley Fernanda ViégasIBM Research Martin WattenbergIBM Research Dagstuhl InfoVis May 2007
evaluation evaluation
observations Groups spent more time in front of the visualization than individuals. Friends encouraged each other to unearth relationships, probe community boundaries, and challenge reported information. Social play resulted in informal analysis, often driven by story-telling of group histories.
NameVoyager The Baby Name Voyager
NameVoyager “Roosevelt has two spikes right about where you'd expect them.”
thesis Visual sensemaking is not only a cognitive exercise but a social activity. Identify conditions for effective visual collaboration across time and space. Design, implement, and evaluate both targeted techniques and holistic systems for asynchronouscollaborative visualization.
sense.usA Web Application for Collaborative Visualization of Demographic Data
exploratory design rationale Sharing within visualization and across the web • View Bookmarking, Textual Discussion Pointing at interesting trends, outliers • Free-form Graphical Annotations Collecting and linking related views • Bookmark Trails, Drag-and-Drop View Linking Awareness of social activity • Serendipitous discovery, Comment listings, Profiles Do no harm—don’t disrupt individual exploration
user study design 30 participant laboratory study • 25 minute, unstructured sessions with job voyager • Think-aloud protocol used, exit survey 3-week live deployment on IBM intranet • Support employees using existing intranet accounts • Advertised through mailing lists and internal news Data analyzed • 12.5 hours of qualitative observation • 258 comments (41 pilot, 85 ibm, 60 ucb, 72 live) • Usage logs of user sessions
content analysis of comments Feature prevalence from content analysis (min Cohen’s = .74) High co-occurrence of Observations, Questions, and Hypotheses
use of annotations shapes Arrows 25.1% ||||||||||||||||||||||||| Text 24.6% ||||||||||||||||||||||||| Ovals 17.9% |||||||||||||||||| Pencil 16.2% |||||||||||||||| Lines 14.5% ||||||||||||||| Rectangles 1.7% || 50% of comments included annotations • Pointing to specific points, trends, or regions • Drawing to socialize or tell jokes Variety of subject responses • ‘Not always necessary’, but ‘surprisingly satisfying’ • Some concern about professional look
navigation Back button highly used and appreciated View indexing aided serendipitous discovery • 15% of views found via multiple parameter settings • 30% of all visits were to these views Views and comments fit power law distribution
survey results Social data analysis fun and educational Users found strong value to others’ comments Own annotations rated higher than others? • Difference is not statistically significant
voyagers and voyeurs Complementary faces of usage Voyager – focus on visualized data • Active engagement with the data • Serendipitous comment discovery Voyeur – focus on comment listings • Investigate others’ explorations • Find people and topics of interest • Catalyze new explorations
future directions Add social navigation cues: scented widgets Enhanced pointing and deictic reference • Selection + emphasis, machine-readability Conduct targeted experiments • Discussion models • Representations for improving integration • Game Play and Incentives
Spotfire Posters Wikimapia.com Swivel.com Many-Eyes.com
Voyagers and VoyeursSupporting Asynchronous Collaborationfor Information Visualization Jeffrey HeerUC Berkeley jheer@cs.berkeley.edu jheer.org | vis.berkeley.edu