Download

1 / 6
60 likes | 174 Views
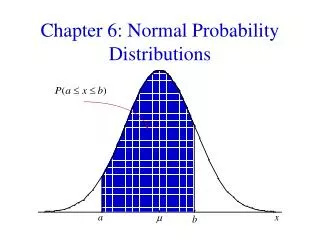
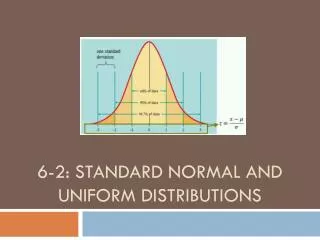
6-3 Standard Units Areas under Normal Distributions. As long as the data follows a normal distribution. Conversion to a z score will be a useful way to make observations. What is the probability that a score will fall between a and b?

E N D
As long as the data follows a normal distribution Conversion to a z score will be a useful way to make observations. What is the probability that a score will fall between a and b? That is, what is the probability that, for a normal distribution with μ = 10 and σ = 2 , an x value will fall between 11 and 14? What would YOU do???
Ideas… Let 11 and 14 equal a and b. Convert them to z scores. That gives .5 and 2.00 Lets go to the chart. How would we find the area of a z score between .5 and 2? Draw a picture. Generally, you take the area of the larger = the smaller
Left of 2 Left of .5 Area between
Lets practice with the table At a particular ski resort, the daytime high temperature is normally distributed during January, with a mean of 22º F and a standard deviation of 10º F. You are planning to ski there this January. What is the probability that you will encounter highs between 29º and 40º
How does the computer do it? Distr: 2:normalcdf(lower, upper, μ, σ) calculates the cumulative area. Dist: 3:invnorm(area, μ, σ) calculates the z score for the given area (as a decimal) to the left of z. *What if you are using a normal curve? What will μ and σ be??