Essential Questions
360 likes | 383 Views
Explore how psychologists use the scientific method, research strengths and weaknesses, and draw conclusions about behavior. Learn about correlational research, operational definitions, data collection, and correlation vs. causation. Understand the importance of variables in studies.

Essential Questions
E N D
Presentation Transcript
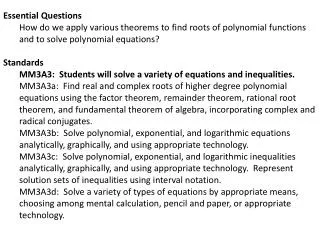
Essential Questions • EQ 1-3: How do psychologists use the scientific method to study behavior and mental processes? • EQ 1-4: What are the strengths and weaknesses of the different research methods? • EQ 1-5: How do psychologists draw appropriate conclusions about behavior from research?
Growth of Psych Approaches to Psych The Science of Psychology Ethics ResearchMethods Statistics Sampling Descriptive Correlation Experiment Descriptive Inferential Naturalistic Observation Case Study Survey Careers We are here
Correlational Research • Purpose – to show relationship between two variables. • Strength – If you know how they are related you can predict outcomes. • Weakness – Correlation is not causation.
Start with two Dependent Variables • DV = HeightDV = Weight • DV = Golf ScoreDV = Number of years the person has played golf • DV = IQ scores DV = Size of your big toe • DV = Salary DV = Happiness
Do the variables vary together? • Are the numbers which represent height somehow related to (vary with) the numbers which represent weight? • Does a person’s golf score vary with years of practice? • Does IQ vary with big toe length? • Does happiness vary with salary?
Next, Create Operational Definitions An exact description of how to derive a value for a characteristic you are measuring. It includes a precise definition of the characteristic and how, specifically, data collectors are to measure the characteristic. It is a way to get a number from one of your variables.
Operational Definitions • How you operationalize the variables will tell us if the study is valid and reliable, and reproducable. Let’s say you’re trying to find out if chocolate causes violent behavior. • What do you mean by chocolate? • What do you mean by violent behavior?
Operational Definitions in green • DV = Height (in inches without shoes) • DV = Weight (in lbs without clothes) • DV = Golf Score (on golf course x)DV = Number of years the person has played golf • DV = IQ scores (from the WAIS test) DV = Size of your big toe (in mm from top of joint to top of toe) • DV = Salary (annual salary including bonuses and benefits) DV = Happiness (???)
Operational Definition Practice: • Memory improves with regular exercise. • Proper nutrition aids alertness in the classroom. • People who are talking on car phones do not drive safely. • Lack of sleep impairs ones judgment. • Participating in sports builds character. • Loving parents produce children who grow up to be honest adults. • Tall people are likely to be extroverts. • Religious people are friendlier than non-religious people.
Next, Collect Data • In correlational research each participant in the research is measured on two different dependent (or criterion) variables. • Are these measurements unrelated to each other or are they somehow related?
Scatterplots Perfect positive correlation (+1.00) Scatterplotis a graph that comprises of points generated by values of two variables. The slope of points depicts the direction, The amount of scatter shows the strength of relationship.
Scatterplots Perfect negative correlation (-1.00) No relationship (0.00) Scatterplot on the left shows a relation between the variables, and the one on the right shows no relationship between the two variables.
Types of Correlation Positive Correlation • The variables go in the SAME direction. Negative Correlation • The variables go in opposite directions. Studying and grades hopefully has a positive correlation. Heroin use and grades probably has a negative correlation.
Indicates direction of relationship (positive or negative) Correlation coefficient Indicates strength of relationship (0.00 to 1.00) Correlation When one trait or behavior accompanies another, we say the two correlate. Correlation Coefficient is a statistical measure of relationship between two variables. r = + 0.37
Correlation Coefficient Which is a stronger correlation? • -.13 or +.38 • -.72 or +.59 • -.91 or +.04
Study of Low Self Esteem and Depression You do the research because you assume the two are related Compare two variables Variable 1 = Score on a self-esteem test Variable 2 = Length of a bought of depression in months
Score on a self-esteem test • Length of a bought of depression in months
ConfoundingVariables • A relationship other than causal might exist between the two variables. It's possible that there is some other variable or factor that is causing the outcome. • Ex: Length of marriage correlates with hair loss in men. Does this mean that marriage causes men to los their hair? Or that balding men make better husbands?
Correlation indicates a possibility of Causation; not proof!! • Children with big feet reason better than children with small feet. • (Children who are older have bigger feet than younger children; thus they can reason better) • Study done in Korea: The most predictive factor in the use of synthetic birth control use was the number of appliances in the home. • (Those who have electrical appliances probably have higher socioeconomic level, and thus are probably better educated.)
Diet soda and weight gain??? The study of more than 600 normal-weight people found, eight years later, that they were 65 percent more likely to be overweight if they drank one diet soda a day than if they drank none. And if they drank two or more diet sodas a day, they were even more likely to become overweight or obese.
The Simpsons(Season 7, "Much Apu About Nothing") Homer: Not a bear in sight. The "Bear Patrol" is working like a charm! Lisa: That's specious reasoning, Dad. Homer: [uncomprehendingly] Thanks, honey. Lisa: By your logic, I could claim that this rock keeps tigers away. Homer: Hmm. How does it work? Lisa: It doesn't work; it's just a stupid rock! Homer: Uh-huh. Lisa: But I don't see any tigers around, do you? Homer: (pause) Lisa, I want to buy your rock.
The number of cavities in elementary school children and vocabulary size are strongly correlated.
In a Gallup poll, surveyors asked, “Do you believe correlation implies causation?’” • 64% of American’s answered “Yes” . • 38% replied “No”. • The other 8% were undecided.
Illusory Correlations Redelmeier and Tversky (1996) assessed 18 arthritis patients over 15 months, while also taking comprehensive meteorological data. Virtually all of the patients were certain that their condition was correlated with the weather. In fact the actual correlation was close to zero. Usually when the data in question stands out
Illusory Correlations • The perception of a relationship where none exists (because we are sensitive to dramatic or unusual events) • Examples from your reading? • Challenger explosion: reverse illusory correlation