Download
1 / 14
140 likes | 164 Views
This study examines the environmental impacts and resulting externalities from air, water, and soil pollution. It focuses on the pathways taken into account for health impacts of air pollutants, including direct emissions to soil or water. The study also discusses linearization of dose-response functions and the justification for equilibrium models. Results are presented for doses, impacts, and social costs, with comparisons to other models. Conclusions highlight the agreement between models for certain pollutants and the need for further research on dose-response functions.

E N D
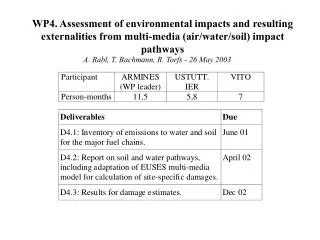
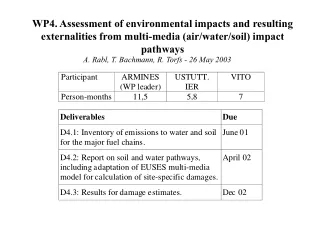
WP4. Assessment of environmental impacts and resulting externalities from multi-media (air/water/soil) impact pathways A. Rabl, T. Bachmann, R. Torfs - 26 May 2003
Pathways taken into account for health impacts of air pollutants. Direct emissions to soil or water are a special case where the analysis begins at the respective “soil” and “water” boxes. In the present version seafood is not yet included.
Linearization of the Dose-Response Functions DRF at two values of the background dose, D1 and D2. For small variations around the background the DRF can be approximated by straight lines with slopes s1 and s2. The slopes can be different between groups with different backgrounds or different sensitivities. For the calculation of population-total impacts one can take the population-weighted average of the slopes. Doses below a NOAEL are a special case with slope zero.
Justification for Equilibrium Models One can show that since with linear dose-response functions only the collective dose matters for the total impact (irrespective of how it is distributed in time or among individuals), a dynamic model consisting of compartments with first order processes, yields exactly the same result as an equilibrium model with the same compartments, regardless of any detail of the time history of the inflow. Therefore an equilibrium model is sufficient for calculating the total dose, even though the real environment is never in equilibrium.
Uniform world model (UWM) • For inhalation • verified by comparison with about 100 site-specific EcoSense calculations (EU, Eastern Europe, China, Brasil, Thailand, …); • recommended for typical values for emissions from tall stacks, more than about 50 m (for specific sites the agreement is usually within a factor of two to three; for ground level emissions damage much larger; apply correction factors). • For ingestion it is even better, because food is transported over large distances average over all the areas where the food is produced. • Most policy applications need typical values (people tend to use site specific results as if they were typical precisely wrong rather than approximately right)
Results for Doses Collective doses for central European conditions in mg/yr (for emission 1 kg/yr) = intake fractions x 1E6 by exposure pathway as a percentage of the total (figure) and in mg per emitted kg (table) for base case (tcut = 100 years). As, Cd, Cr and Ni are modeled as PM10 and Pb as PM2.5; Hg is modeled as metallic Hg for inhalation, methyl Hg for ingestion.
Comparison with CalTOX (a model based on fugacity) Ratio of total doses calculated by our model (UWM) and by CalTOX, after multiplying the CalTOX results by the ratio 80/29 of population densities in central Europa and the USA.
Results for Impacts and Social Costs CRFs, DRFs and impacts, per kg emitted, for the carcinogenic metals. Unit risk and slope factor from IRIS http://www.epa.gov/iris.
Damage cost of IQ decrement due to Pb • Dose-response function is quite well determined [meta-analysis by Schwartz 1994]: 0.026 IQ points per 1 µg/l increase of Pb in blood, • linear without threshold. • Cost 3000 €/IQ point • Two calculations: • a) 1.0 g/m3 incremental exposure to Pb in ambient air increases the blood level by 50 µg/l, 1.3 IQ points per child per g/m3 Express in terms of total population (sensitive population 1 to 3 yr) sCR = 1.43E-2 IQ points/(pers·yr·(g/m3)) 804 €/kg, with relation blood/air b) relation between blood level Pb and ingestion dose [WHO 1995] sDR = 3.32E+03 IQpoints/(pers.kg) • 1633 €/kg, with relation blood/ingestion. Limit for unleaded gasoline after 2000 is 5mg/l [EC 1998]. At this level, and with 1633 €/kg, the associated damage cost would be 0.008 €/l.
Vito, Rudi TorfsModel comparison • Examine Vlier-human (VH) model from Vito • Define most sensitive parameters • Set parameters to values used in UWM • Calculate (total dose)/(inhalation dose) • To compare with UWM results • Do some sensitivity analysis
(VITO) Example Ni
Conclusions (VITO) • Ni : good agreement between the ingestion/inhalation ratio of VH and UWM. • Cr : mismatch between the two models, perhaps due to the drinking water pathway. • Pb : VH model with parameters set to the UWM values gives a ratio that is 3 to 4 times higher than that of UWM • VH-model as a local component?
Conclusions • Have results for doses and impacts for cancers due to As, Cd, Cr and Ni, and for IQ due to Pb • Have all the major pathways, except seafood • Have sensitivity analysis • What time horizon? Significant contributions >100 yr for Hg and Pb. • Ingestion dose for toxic metals about two orders of magnitude larger than inhalation dose • Large uncertainty for doses (order of magnitude?) • Lack of information on DRFs (for most noncancer effects, e.g. due to Hg, only NOAEL or LOAEL data - not sufficient for quantification of impacts) • What is included in DRF: only inhalation or also ingestion?