Download
1 / 17
170 likes | 200 Views
Explore how Swedish refineries have significantly reduced sulphur dioxide and NOx emissions since the 1980s, focusing on energy efficiency, fuel usage, and emissions control technologies. Learn about specific reduction achievements and the importance of minimizing environmental impact.

E N D
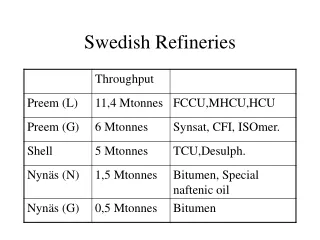
Sulphur dioxide emissions refineries • Annual emissionRecovered sulphur • 1985 9200 tonnes (22 000 tonnes S) • 1990 5500 tonnes • 1995 1950 tonnes • 1997 (64 000 tonnes S) • 2001 1600 tonnes • 2004 1500 tonnes +64000 tonnes S
Nox emissions refineries • 1990 2800 tonnes (~90 mg/MJ) • 1995 2250 tonnes (72 mg/MJ) • 2001 1676 tonnes (50 mg/MJ) • 2004 1475 tonnes (41 mg/MJ) 50 mg/MJ=~180 mg/Nm3
Minimize NOx emissions • Energy efficiency • Maximize share of gas as fuel • Low NOx burners • SNCR and SCR for certain units
SCR at Swedish refineries • Preem (L) FFCU 90 % red. (1994) • Shell Boiler (1998) • Preem (G) Reformer 91 % red. (1998) CDU 77 % (2003)
Refinery total 2006NOx emissions Preem (L) • 26.000 TJ • 37 mg/MJ (2005 34 mg/MJ) • Average • 867 Tonnes NOx/year (2005 655 t/y)
Sulphur 2004/2006 • Low sulphur fuel • Large share of fuel gases Preem (G) 91 % Preem (L) 84 % • Use of natural gas Preem (G) 12 % • Low S content in gas Preem (L) 0,03 % S • Minimize oil use Preem (G) 9 % Preem (L) 4 %
SRU • Claus unit+ Tail gas treatment unit • Preem (G) 99,6 % recovered S (99,0 including flared acid gas) • Preem (L) 99,7 % recovered S
Preem Refinery – VOC monitoring Tonnes/year Concawe estimate 600 tonnnes/Y