Download
1 / 25
250 likes | 284 Views
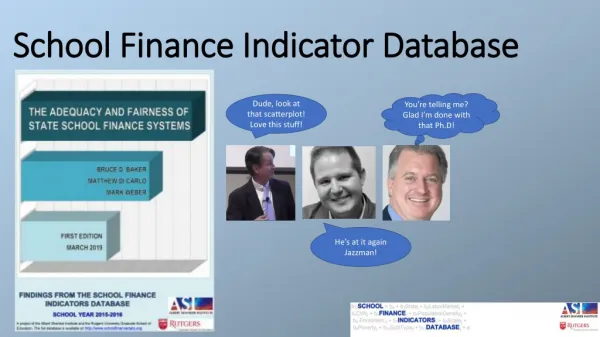
A detailed analysis of school performance indicators based on 2016-2017 data as per approved ESSA plan. Includes weighted achievement, value-added growth, graduation rates, and SQSS components. Statistical markers and percentiles for various criteria.

E N D
2016 ESSA School Index and Indicator Summary Statistics Final Calculations Based on Approved ESSA Plan and Final 2016 and 2017 Data Completed 030618
2016 ESSA School Index Score: Statistical Markers for Distributions by Grade Span* *Percentiles are calculated for all schools in the grade span including schools participating in Title I and schools not participating or not eligible.
2016 Weighted Achievement: Means and Variation by Grade Span
2016 Weighted Achievement: Statistical Markers for Distributions by Grade Span
2016 School Value-Added Growth: Means and Variation by Grade Span
2016 School Value-Added Growth: Statistical Markers for Distributions by Grade Span
2015 Adjusted Cohort Graduation Rates: Means and Variation by Grade Span
2015 Adjusted Cohort Graduation Rates: Statistical Markers for Distributions by Grade Span Note: ESSA School Index uses lagged graduation rates.
2016 School Quality Student Success (SQSS): Means and Variation by Grade Span
2016 School Quality Student Success (SQSS): Statistical Markers for Distributions by Grade Span
2016 Percent of Points Earned for Chronic Absence for Students in Grades K - 11 Includes full academic year students (not highly mobile). Students enrolled continuously from October 1 through Cycle 7. Attendance from quarters 1 – 4 Cycle 7 enrollment
2016 Percent of Points Earned for Reading Achievement for Students in Grades 3 - 10 Includes full academic year students (not highly mobile). Students enrolled continuously from October 1 through testing. MSAA excluded due to lack of Reading Score—Only ELA score available.
2016 Percent of Points Earned for Science Achievement for Students Grades 3 - 10 Includes full academic year students (not highly mobile). Students enrolled continuously from October 1 through testing.
2016 Percent of Points Earned for Growth in Science Achievement for Students Grades 4 - 10 Includes full academic year students (not highly mobile). Students enrolled continuously from October 1 through testing. ACT Aspire Science scores only.
2016 Percent of Points Earned for ACT Composite Score of 19 for students in Grade 12 The ACT Composite includes students in Grade 12 cycle 7 certified data with ACT scores. Highly mobile students are excluded Uses best ACT Composite score from any of previous 3 years.
2016 Percent of Points Earned for ACT Scores at/above ACT College Readiness Benchmark for Students in Grade 12 The ACT College Readiness calculation includes students in Grade 12 cycle 7 certified data with ACT scores. Highly mobile students are excluded. Uses best ACT Composite score from any of previous 3 years.
2016 Percent of Points Earned for Students Earning On-Time Credits for Grade Levels 9-11 Students' on-time credits are calculated for students in Grades 9 - 11 for each school. Grades included in the score are based on the school's actual grade range. Highly mobile students are excluded
2016 Percent of Points Earned for High School GPA of 2.8 or Higher for students in Grade 12 ≥ Includes Grade 12 students from cycle 7 with full academic year in Grade 12 (not highly mobile). Uses students’ Cycle 7 reported high school GPA.
2016 Percent of Points Earned for Grade 12 Students Completing AP, IB, or Concurrent Credit Course(s) Includes ACE Concurrent Credit Courses The AP/IB/Concurrent Credit calculation includes students in Grade 12 cycle 7 certified data with course credit records from any of grades 9 - 12. Highly mobile students are excluded.
2016 Percent of Points Earned for Grade 12 Students Completing Computer Science Course(s) The Computer Science Credit calculation includes students in Grade 12 cycle 7 certified data with course credit records from any of grades 9 - 12. Highly mobile students are excluded.
2016 Percent of Points Earned for Grade 12 Students Completing Community or Service Learning Course(s) The Community or Service Learning Credit calculation includes students in Grade 12 cycle 7 certified data with course credit records from any of grades 9 - 12. Highly mobile students are excluded.
ESSA School Index Scores at 1st and 5th Percentiles* of Statewide Title I School Distributions *Fifth Percentile values in this table are based on the Title I participating schools in each grade span; thus these values may differ from the Percentile values reported when including all schools. Districts with one or more schools that have one or more subgroups whose ESSA School Index score is at or below the ESSA School Index Score at 1st percentile each year for three consecutive years will be notified of their schools which have consistently underperforming subgroups and are eligible for Targeted Support and Improvement. Districts will be notified annually based on the three most current years of ESSA School Index scores of subgroups meeting the minimum N of 15 for all indicators in all three years. Beginning in 2018, schools with consistently underperforming subgroups whose subgroup ESSA School Index scores are at or below the ESSA School Index score at the 5th percentile, will be eligible for Additional Targeted Support and Improvement. This eligibility will be evaluated every three years.