Download
1 / 48
480 likes | 698 Views
ESTIMATION AND MODEL FIT. LECTURE 2 EPSY 651. ORDINARY LEAST SQUARES. Minimize sum of squared errors: SSe = (y – y hat ) 2 Best Linear Unbiased Estimates (BLUE) are B = (X’X )-1 X’y In SEM this is translated as F = (s- )’ (s- ) Also termed Unweighted Least Squares.

E N D
ESTIMATION AND MODEL FIT LECTURE 2 EPSY 651
ORDINARY LEAST SQUARES Minimize sum of squared errors: SSe = (y – yhat)2 Best Linear Unbiased Estimates (BLUE) are B = (X’X)-1X’y In SEM this is translated as F = (s-)’ (s-) Also termed Unweighted Least Squares
ORDINARY LEAST SQUARES ASSUMPTIONS Normality of endogenous variables Uncorrelated errors Homogeneity of errors for conditional values of predictors Not robust with respect to violations, particularly skewness for estimating mean differences, kurtosis for estimating covariances among variables
WEIGHTED LEAST SQUARES Minimize f = ½ tr [ I – S-1() ] Where I = Identity matrix and S-1 = inverse of sample covariance matrix ( S S-1 = I ) tr is the “trace” of a matrix (sum of the diagonal elements of the matrix) Simpler, but may not be as robust overall
MAXIMUM LIKELIHOOD minimize FML = ln| ()| + tr)S-1())– ln|S| - (p+q) Where () is the hypothesized model cov- ariance matrix S is the sample covariance matrix p is the number of exogenous var’s q is the number of endogenous var’s
MAXIMUM LIKELIHOOD ASSUMPTIONS Multivariate normality on the p+q variables Mardia’s statistic is used to test this some evidence this is too strict local independence: estimates are asymp- totically independent i / (ij ) = 0 Correct model specification All data present
MAXIMUM LIKELIHOOD VIOLATIONS OF ASSUMPTIONS Nonnormality: little effect on estimates or standard errors for moderate violations (Lei & Lomax, 2005 SEM) but n> 100 Better than GLS, WLS under nonnormality (Olsson, Foss, Troye & Howell, 2000 SEM) Errors correlated: can affect estimates and standard errors (Yuan, 2004; Box, 1954)
RESTRICTED MAXIMUM LIKELIHOOD This method uses OLS or related estimates for fixed effects (all conditions of the population present in the study) and ML for the residuals of the fixed effects Used in multilevel modeling (HLM analysis), discussed later in the course
ASYMPTOTICALLY DISTRIBUTION FREE (ADF) Minimizes F = (s-)’ W-1(s-) Where s’ = (s11, s21, s31, …spp) ’ = (11, 21, 31, … pp) W = some weight function Browne (1984) showed all fit functions are special cases of this function Theoretically it should work well, but does not appear as robust or efficient even for large sample size as ML and its variants
ML VARIANTS ML with Satorra-Bentler ADF approximations for standard errors and chi square statistic; approximates chi square as a sum of chi squares weighted by functions of a WLS type estimate Used with nonnormal data to estimate fit statistics based on the chi square, works better than standard estimates with non- normal data (Chou, Bentler, & Satorra, 1991; Hu, Bentler, & Kano, 1992; Curran, West, & Finch, 1996)
ML VARIANTS ML with Satorra-Bentler : in MPLUS termed MLM LISREL: Diagonally weighted least squares EQS: option available AMOS 7: does not include SAS Proc CALIS: not available
ML VARIANTS ML with Yuan-Bentler chi square T-square test statistic; used for nonnormal data with so-called sandwich estimator; useful for small sample data
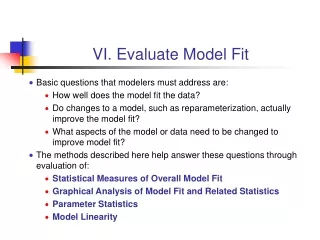
MODEL EVALUATION Statistical analysis Fit indices
FIT AND LIKELIHOOD FUNCTIONS Fit functions (equivalent to log(L), log of maximum likelihood function) FML = log|()| + tr{S-1()|} -log|S| - (p+q) FGLS = ½ tr{[ I - ()S-1 ]2} FGLS = ½ tr{ [S - () ]2 }
FIT AND LIKELIHOOD FUNCTIONS -2log(L0/L1) = (N-1) FML ~2 (df = df1 – df0) log L0 = -{(N-1)/2}{ log |(0)| + tr{-1(0)S} = -{(N-1)/2}{ log |S)| + p+q} under perfect fit and df0 = 0 log L1 = -{(N-1)/2}{ log |(1)| + tr{-1(1)S}
GOODNESS OF FIT INDEX GFI = F1/F0 note: GFI = 1.0 if fit is perfect; it is the ratio of the chi square under the fitted model to the chi square under no fit AGFI = 1 – [q(q+1)/2df1] [ 1 – GFI ] RMR = [ Sum(Sij -( ))2 /(p+q)(p+q+1)/2)]½ = square root of mean of residuals of variances and covariances between observed and fitted covariance matrices SRMR = SQRT ( average {residual/sresid})
INCREMENTAL FIT INDICES NFI = (b2 - m2 )/ b2 where b=baseline, m = model Tucker-Lewis = (b2 /dfb - m2 /dfm) /(b2 /(dfb-1)) = NNFI (nonnormed fit index) CFI = 1-{max(m2 -dfm,0)} / {max(( b2 -dfb), (b2 - dfb),0}
PARSIMONY-ADJUSTED FIT INDICES COMPARED TO S RMSEA = ½ ((m2 /(n-1)dfm)-(dfm/((N-1)dfm))) Parsimony ratio PR = df(model)/df(maximum possible df) Parsimonious GFI PGFI = GFI * dfm/dfb PNFI = NFI*PR PCFI = CFI*PR
INFORMATION-BASED INDICES Akaike Information Criterion AIC = (m2 /N) + (2k/(N-1)), k= (.5v(v+1))-dfm, v = # parameters fitted Bayesian Information Criterion BIC = m2 /N) + ((2k)/(N-v-2) Both are used to compare non-nested models – lower values indicate better fit Other related statistics: The Consistent AIC (CAIC) adjusts for both sample size and model complexity and is interpreted in the same way as the AIC Browne-Cudeck Criterion (BCC) is a cross-validation statistic BCC = F(ML) + 2q/n
EVALUATING A MODEL • Hu, L., & Bentler, P. M. (1999). Cutoff criteria for fit indexes in covariance structure analysis: Conventional criteria versus new alternatives. Structural Equation Modeling, 6, 1-55. • use CFI> .95, TLI>.95, RMSEA<.06 • Fan, X. and Sivo, S.A. (2005) Sensitivity of fit indices to misspecified structural or measurement model components: rationale of two-index strategy revisited. Structural Equation Modeling, 12, 3, 343-367. • Yuan, K.H. (2005) Fit indices versus test statistics. Multivariate Behavioral Research, 40, 1, 115-148. • Their conclusions: depends on the model and on misspecifying the model. NO ONE CRITERION WILL WORK
EVALUATING A MODEL • Hayduk: chi square statistic is the only test of significance; all other statistics are derivatives and not necessarily statistically better • Chi square tests’ power increases with sample size; SEM is a large sample method; therefore, you will almost always reject a model with large N • Conclusion: chi square testing is useless
EVALUATING A MODEL • Chi square DIFFERENCE testing between competing, nested models is the most useful statistical test and approach to model evaluation • Compare a model with simpler ones, not with a null model- you will almost certainly always reject the null model, but so what?
MODIFICATION INDICES • WALD STATISTICS: test if a path should be removed (parameter = 0) • LAGRANGE MULTIPLIER: test if a path should be added (parameter changed to nonzero value) • Chi Square statistics equivalent to holding model constant except for the parameter being considered (ie chi square difference between baseline and model in slides above) • Can only be computed with full data (no missing data elements)
MODIFICATION INDICES • Use as evidence to change a model • Recommended statistical approach: • Liberal alpha level for statistical test if parameter was theoretically specified • Conservative alpha level for statistical test if parameter was not theoretically specified • Only one change can be made at a time, each change affects all other parameters and modification indices • MI chi square will NOT equal model chi square improvement, should be close, however
Evaluating a data analysis with AMOS Predict Teacher Salary from predictors: Enrollment Local revenues available Percent majority students Student-Teacher ratio
AMOS REGRESSION ANALYSIS- OUTPUT Your model contains the following variables (Group number 1) Observed, endogenous variables LOGPAY Observed, exogenous variables LOGENROLL LOGREVLOC MAJPCT01 TCHSTD01 Unobserved, exogenous variables Epay Variable counts (Group number 1) Number of variables in your model:6Number of observed variables:5Number of unobserved variables:1Number of exogenous variables:5Number of endogenous variables:1
AMOS REGRESSION ANALYSIS- OUTPUT Parameter summary (Group number 1) WeightsCovariancesVariancesMeansInterceptsTotalFixed200002Labeled000000Unlabeled3654119Total5654121Models Default model (Default model) Notes for Model (Default model) Computation of degrees of freedom (Default model) Number of distinct sample moments:20 Number of distinct parameters to be estimated:19 Degrees of freedom (20 - 19):1 Result (Default model) Minimum was achieved Chi-square = .047 Degrees of freedom = 1 Probability level = .829
AMOS REGRESSION ANALYSIS- OUTPUT Regression Weights: (Group number 1 - Default model) Estimate S.E. C.R. P Label LOGPAY<---LOGENROLL .145 .010 14.589 *** LOGPAY<---LOGREVLOC .060 .007 8.698 *** LOGPAY<---MAJPCT0 1.000 LOGPAY<---TCHSTD01 -.017 .004 -4.696 *** Standardized Regression Weights: (Group number 1 - Default model) Estimate LOGPAY<---LOGENROLL.695 LOGPAY<---LOGREVLOC.317 LOGPAY<---MAJPCT01.000 LOGPAY<---TCHSTD01-.129
AMOS REGRESSION ANALYSIS- OUTPUT Means: (Group number 1 - Default model) Estimate S.E. C.R. P Label LOGENROLL 7.198 .047 153.236 *** LOGREVLOC 15.040 .0522 90.870 *** MAJPCT01 61.018 .907 67.263 *** TCHSTD01 12.598 .074 171.216 *** Intercepts: (Group number 1 - Default model) Estimate S.E. C.R. P Label LOGPAY 9.613 .0651 48.875 ***
AMOS REGRESSION ANALYSIS- OUTPUT Covariances: (Group number 1 - Default model) Estimate S.E. C.R. P Label LOGENROLL<-->LOGREVLOC 1.890 .0961 9.665 *** MAJPCT01<-->TCHSTD01 -11.956 2.007 -5.957 *** LOGREVLOC<-->TCHSTD01 2.121 .133 15.927 *** LOGREVLOC<-->MAJPCT01 -9.888 1.421 -6.957 *** LOGENROLL<-->MAJPCT01 -12.684 1.327 -9.561 *** LOGENROLL<-->TCHSTD01 2.427 .1311 8.531 *** Correlations: (Group number 1 - Default model) Estimate LOGENROLL<-->LOGREVLOC .897 MAJPCT01<-->TCHSTD01 -.207 LOGREVLOC<-->TCHSTD01 .643 LOGREVLOC<-->MAJPCT01 -.243 LOGENROLL<-->MAJPCT01 -.343 LOGENROLL<-->TCHSTD01 .810
AMOS REGRESSION ANALYSIS- OUTPUT Variances: (Group number 1 - Default model) EstimateS.E.C.R.P Label LOGENROLL 1.913 .092 20.821 *** LOGREVLOC 2.317 .111 20.817 *** MAJPCT01 713.50 34.269 20.821 *** TCHSTD01 4.694 .225 20.821 *** Epay .017 .001 20.819 *** Squared Multiple Correlations: (Group number 1 - Default model) Estimate LOGPAY .799
AMOS REGRESSION ANALYSIS- OUTPUT Model Fit Summary CMIN Model NPAR CMIN DF PCMIN/DF Default model 19. 0471.829.047 Saturated model20.0000 Independence model53990.05815.000266.004 Baseline Comparisons Model NFI RFI IFI TLI CFI Delta1 rho1 Delta2 rho2 Default 1.000 1.000 1.000 1.004 1.000 Saturated model 1.000 1.000 1.000 Independence .000 .000 .000 .000 .000 Parsimony-Adjusted Measures Model PRATIO PNFI PCFI Default .067 .067 .067 Saturated .000 .000 .000 Independence 1.000 .000 .000
AMOS REGRESSION ANALYSIS- OUTPUT RMSEA Model RMSEA LO 90 HI 90 PCLOSE Default .000 .000 .054 .941 Independence .553 .538 .567 .000 AIC Model AIC BCC BIC CAIC Default 38.047 38.311 Saturated 40.000 40.279 Independence 4000.058 4000.128
MPLUS REGRESSION analysis INPUT CODE: TITLE: TEXAS A&M SUMMER INSTITUTE REGRESSION EXAMPLE PREDICTING TEACHER SALARY FROM 3 PREDICTORS DATA: FILE IS SUMMER INSTITUE EXAMPLE REGRESSION.dat; VARIABLE: NAMES ARE TCHSAL01 TCHSTD01 WHTPCT01 TAAS801 LPROPTX LLOCTAX LENROL01 LSUPPY01; USEVARIABLES ARE TCHSAL01 WHTPCT01 LPROPTX LENROL01; MODEL: TCHSAL01 ON WHTPCT01 LPROPTX LENROL01; OUTPUT: STANDARDIZED;
MPLUS REGRESSION analysis OUTPUT • MODEL RESULTS • Estimates S.E. Est./S.E. Std StdYX • TCHSAL01 ON • WHTPCT01 -17.820 2.481 -7.183 -17.820 -0.189 • LPROPTX 1510.289 88.070 17.149 ******* 0.425 • LENROL01 899.791 46.613 19.304 899.791 0.502 • Residual Variances • TCHSAL01 ********* ******* 21.201 ******* 0.535 • R-SQUARE • Observed • Variable R-Square • TCHSAL01 0.465
Evaluating a data analysis with MPLUS Reanalysis of the Salary data • including student-teacher ratio • restricting the stdt-tchr path to salary to zero to test its necessity • Why include a variable with zero path? • 1. evaluate its spurious contribution • 2. suppressor effect potential • 3. evaluate complete model with all variables
PATH MODEL- ML ESTIMATES IN STANDARDIZED FORM R2 = 0.465 LENROLL .502 .80 -.097 1 - .465 = .731 .425 LPROPTAX TCHR SALARY -.346 e 2e = .7312 = .535 .169 % MAJ ORITY 0 -.189 -.267 STUDENT TEACHER RATIO -.204
MPLUS Model Fit Chi-Square Test of Model Fit Value 2.249 Degrees of Freedom 1 P-Value 0.1337 Chi-Square Test of Model Fit for the Baseline Model Value 564.867 Degrees of Freedom 4 P-Value 0.0000 CFI/TLI CFI 0.998 TLI 0.991 Loglikelihood H0 Value -16207.536 H1 Value -16206.412
Model Fit continued Information Criteria Number of Free Parameters 4 Akaike (AIC) 32423.072 Bayesian (BIC) 32442.278 Sample-Size Adjusted BIC 32429.574 (n* = (n + 2) / 24) RMSEA (Root Mean Square Error Of Approximation) Estimate 0.037 90 Percent C.I. 0.000 0.105 Probability RMSEA <= .05 0.501 SRMR (Standardized Root Mean Square Residual) Value 0.005
Model Revision • Theoretical issue: should you revise the model? • What about sample specificity (changes hold for the sample but not for the population) • What happened to confirmation of the theory? • How much revision? • Where to revise- error covariances vs. path changes
Model Revision Some considerations: • Split sample, model and revise on 1 sample, confirm on the other • Start with confirmation; if it fits, stop; if it fits poorly, revise • Begin with error covariances that are nonzero: they imply reliable covariance not modeled in your study • Consider paths (or factor loadings, to be discussed tomorrow) from theoretical perspectives first: do they make sense to change? • Retain general theoretical direction of the model rather than change directions inconsistent with previous research
LISREL TUTORIAL: http://www.utexas.edu/its/rc/tutorials/stat/lisrel/lisrel8.html Syntax approach
INPUT SYNTAX Stability of Alienation ! See LISREL8 manual, p. 207 ! Chapter 6.4: Two-wave models DA NI=6 NO=932 LA ANOMIA67 POWERL67 ANOMIA71 POWERL71 EDUC SEI CM FI=ex64.cov MO NY=4 NX=2 NE=2 NK=1 BE=SD TE=SY,FILE ALIEN67 ALIEN71 LK SES FR LY(2,1) LY(4,2) LX(2,1) TE(3,1) TE(4,2) VA 1 LY(1,1) LY(3,2) LX(1,1) OU
GOODNESS OF FIT STATISTICS CHI-SQUARE WITH 4 DEGREES OF FREEDOM = 4.73 (P = 0.32) ESTIMATED NON-CENTRALITY PARAMETER (NCP) = 0.73 90 PERCENT CONFIDENCE INTERVAL FOR NCP = (0.0 ; 10.53) MINIMUM FIT FUNCTION VALUE = 0.0051 POPULATION DISCREPANCY FUNCTION VALUE (F0) = 0.00079 90 PERCENT CONFIDENCE INTERVAL FOR F0 = (0.0 ; 0.011) ROOT MEAN SQUARE ERROR OF APPROXIMATION (RMSEA) = 0.014 90 PERCENT CONFIDENCE INTERVAL FOR RMSEA = (0.0 ; 0.053) P-VALUE FOR TEST OF CLOSE FIT (RMSEA < 0.05) = 0.93 EXPECTED CROSS-VALIDATION INDEX (ECVI) = 0.042 90 PERCENT CONFIDENCE INTERVAL FOR ECVI = (0.041 ; 0.052) ECVI FOR SATURATED MODEL = 0.045 ECVI FOR INDEPENDENCE MODEL = 2.30 CHI-SQUARE FOR INDEPENDENCE MODEL WITH 15 DEGREES OF FREEDOM = 2131.40 (Further output not shown)
If you plan to have LISREL read full matrices you create with other software products, you must use the FU keyword. • CM FI=ex64.cov FU • The MO line defines the model. NY and NX define the number of measurement or observed variables present. Notice that you can have two sets of measured variables, one set on each end of a structural model. A structural model is the portion of your model composed exclusively of latent variables (as opposed to measurement variables). NX identifies the "starting" or "upstream" side of your model; NY refers to the "finishing" or "downstream" side of your model. • NE and NK define the number of latent variables associated with the observed variables of NY and NX, respectively. In the example program, there are four observed variables (NY) influenced by two latent NE variables. There are two observed variables (NX) influenced by one NK latent variable. • The LE and LK commands allow you to label the latent variables numbered in the NE and NK commands, respectively. In this example, the two NE latent variables are called ALIEN67 and ALIEN71. The single NK variable is called SES.
Stability of Alienation ! See LISREL8 manual, p. 207 ! Chapter 6.4: Two-wave models DA NI=6 NO=932 LA LABELSANOMIA67 POWERL67 ANOMIA71 POWERL71 EDUC SEI CM FI=ex64.cov COVARIANCE MATRIX INPUTMO NY=4 NX=2 NE=2 NK=1 BE=SD TE=SY,FI MODELWITH 4 ENDOGENOUS 2 EXOGENOUS MANIFEST VARIABLES, 2 ENDOGENOUS LATENT VARIABLES (NE), ONE EXOGENOUS LATENT VARIABLES (NK), FULL SUBDIAGONAL B-MATRIX, ENDOGENOUS ERROR MATRIX (TE) IS SYMMETRIC AND LE LATENT ENDOGENOUS LABELSALIEN67 ALIEN71 LK LATENT EXOGENOUS LABELSSES FR LY(2,1) LY(4,2) LX(2,1) TE(3,1) TE(4,2) FREE PARAMETERSVA 1 LY(1,1) LY(3,2) LX(1,1) VALUES FOR PARAMETERSOU OUTPUT
LISREL MATRIX MODES • Matrix Default Form Default Mode Possible Forms LY FU FI ID, IZ, ZI, DI, FU LX FU FI ID, IZ, ZI, DI, FU BE ZE FI ZE, SD, FU GA FU FR ID, IZ, ZI, DI, FU PH SY FR ID, DI, SY, ST PS DI FR ZE, DI, SY TE DI FR ZE, DI, SY TD DI FR ZE, DI, SY