Download
1 / 45
450 likes | 463 Views
This article explores the evolving structure of the internet, focusing on the interaction of internet service providers as a technical, economic, and international trade issue. It discusses the shift from circuit-based to packet-based interconnection, the challenges of settlement arrangements, and the changing cost structure of undersea cable systems as a reflection of broader industry trends.

E N D
The Changing Structure of the Internet Geoff Huston Telstra June 2001
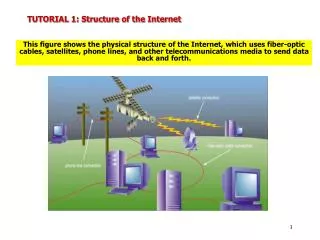
What are we looking at here? • One of the major topics of interest in the Internet is the interaction of Internet Service Providers: • As a technical issue • As an economic issue • As an international trade issue • As a potential topic of national and international policy
The Changing Structure of the Internet • The Packet View • Cable Trends • Network Metrics • Trends in Internet Structure
The Packet View • A comparison of inter-provider settlement arrangements, looking at the PSTN use of call accounting as a settlement mechanism, and comparing this to the Internet environment • The comparison can be characterized as a shift from a transaction unit of circuits to packets
Call Model Settlements • Every inter-provider circuit is used to support bilateral dynamic virtual circuits (calls) • Each circuit is bilaterally funded • Every call has an originator and a terminator • The originator pays the originating provider • The originating provider pays the terminating provider Provider A (Originating) Provider B (Terminating) Mary John
Call Model Settlements • Settlement balance based on call origination to termination imbalance using a common call accounting rate 1000 call minutes @ $3.00 per minute = $3,000 100 call minutes @ $3.00 per minute = $300
Packets are Different • Packet networks do not have such well defined transactions as paid calls • It is appropriate to look at the components of inter-provider interconnection: • the interconnection ‘circuit’ • the interconnection packet flow
The Packet-Transit Model • Bilateral inter-provider carriage circuit is used to support bi-directional packet flow • Each carriage circuit is fully funded by one provider or bilaterally funded • The circuit-based packet financial relationship is based on a larger set of structural criteria • Packets passing across the circuit are either funded by the packet originator or packet terminator, or neither.
The Packet-Transit Model • Every packet passing through a network has only two potential sources of funding: the sender and the recipient • Every packet in the Internet today is bilaterally partial path funded: • Sender-pays, then • Hand-over, then • Receiver pays Handover Receiver pays For transit Sender pays For transit Sender Receiver
The Packet Transit Model • The inter-provider relationships are not packet-dependant – they are statically negotiated and hold for all traffic passing across an inter-provider interface – in both directions • Sender-pays all infers • Customer -> Provider relationship • Handover infers • Provider <-> Provider SKA peering • Receiver-pays all infers • Provider -> Customer relationship
provider customer John A John funds partial path SKA handover Mary funds partial path provider customer B Mary customer provider The Packet Transit Model • Transit packet funding
Packet-Based Interconnection • Three major issues are relevant in an interconnection negotiation for packet handover: • The relative relationship between the two providers • Customer / Provider or Peer / Peer • The relative network location of the handover • Interconnection financial arrangement • The resolution of the third issue is generally a function of the outcome of the first two issues
Provider A Provider B Internet Interconnection Outcomes • The most stable outcome is a static bilateral agreement creating a provider / customer relationship, or SKA peer relationship between the two providers • i.e. there are only three stable outcomes B is a customer of A A is a customer of B SKA
Interconnection Dynamics • Every ISP wants to position itself within the inter-provider space so as to maximize revenue and minimize expenditure: • Every Customer wants to be a SKA Peer with its current provider • Every Peer wants to be a Provider to its current Peer • Every Provider wants to convert its current peers into Customers • There are no objective metrics that determine the outcome any particular bilateral relationship. Each outcome is individually negotiated
The Changing Structure of the Internet • The Packet View • Cable Trends • Network Metrics • Trends in Internet Structure
Technology Trends for Cable Systems Part of the changing nature of the Internet is an outcome of the rapidly decreasing cost of packet carriage and packet switching. As the unit cost of packet carriage declines the value of a Provider’s transit service also declines. This decline alters the balance between a transit provider and its current customers. This section examines the changing cost structure of undersea cable systems as an example of a broader industry trend Optical Transmission Capacity 5 Switching Capacity (Moore’s Law) 4 Growth Factor 3 2 1 1 2 3 4 5 Years
Technology Trends • Undersea Cable Systems • Technology refinements, plus open competitive markets have created dramatic construction activity levels in recent years • This has changed the market from scarcity demand pull to considerable overhang in supply • This over-supply is creating price changes in the market…..
Cable Supply Models The unit of capacity that is purchased from the cable system has increased 1,00-fold over 4 years Up to 1998: Retail T1/E1, T3 1999 – Wholesale T3/STM-1 available everywhere IRU or Capital Lease + O&M 2000: Wholesale STM-4c available 2001: Wavelength (2.5G/10G) offering
Cable Price Movements Capacity between Tokyo and the West Coast $ / Mbps / Month
The Tug of War of the Cost of Cable For suppliers: The first system to connect bandwidth-starved points may capture sales at a much higher price than when the rest of the bandwidth barons (private or consortium) join in. For Buyers: The opposite strategy holds true: If you don’t like bandwidth prices now, wait a bit. They will likely change soon enough.
The Changing Structure of the Internet • The Packet View • Cable Trends • Network Metrics • Trends in Internet Structure
Internet Metrics • Methodology: • Routing information is an abstract picture of the inter-provider topology of the network • Take regular ‘snapshots’ of the Internet’s global routing table • Changes in the topology and structure of the inter-provider Internet are reflected by trends in aspects of the routing system
Internet Metrics • Number of routing entries is growing exponentially Exponential trend of growth
Internet Metrics • Number of distinct IP Network Providers is growing exponentially
Internet Metrics • There are an increasing number of distinct ISP providers within the global routing tables • Each ISP appears to have a distinct set of interconnection policies • Carriage costs are declining faster than provider’s transit costs • Each ISP can improve their financial position by increasing the number of peer connections and reducing their transit requirements
Internet Metrics • Reachability by AS hops is getting smaller Address Span Trend to reduce AS hops Data taken from AS 1221 February 2001 AS Hops
Internet Metrics • AS Reachability by AS hops is also getting smaller Reachable AS’s AS Hops
Internet Metrics • More Specific advertisements are growing exponentially Multi-Homed networks are increasing
Internet Metrics • Distribution of originating address sizes per AS • Address advertisements are getting smaller Non-Hierarchical Advertisements Number of AS’s Prefix Length
Internet Metrics • The time series data of ‘density of interconnection’ shows an increasing number of neighbors for each distinct network • The network structure is becoming more heavily ‘meshed’
The Changing Structure of the Internet • The Packet View • Cable Trends • Network Metrics • Trends in Internet Structure
The Hierarchical View • The ‘traditional’ view of the Internet saw the Internet described as a hierarchy of providers • Segmentation of Internet Providers into a number of ‘tiers’ • Each ISP purchases service from a single provider at the next higher tier • Each ISP sells service to multiple customers at the next lower tier
End User End User Little ISP Big ISP The Hierarchical View End User End User End User End User Littler ISP Littler ISP Littler ISP Littler ISP Littler ISP Little ISP Little ISP Little ISP Big ISP Big ISP
Hierarchical Evolution – Tiers and Multi-homing • This hierarchy has been evolving due to competitive pressures in the provider market and opportunities for lateral peering • May use 2 or more upstream providers (multi-homing) • May use SKA peering within a tier
End User End User Little ISP Big ISP Hierarchical Evolution – Tiers and Multi-Homing End User End User End User End User Littler ISP Littler ISP Littler ISP Littler ISP Littler ISP Little ISP Little ISP Little ISP Big ISP Big ISP Peering Links Multi-homing links
Non-Hierarchical Evolution • May peer across tier levels • May use ‘paid peering’ as a form of limited provider-based transit services • (the use of ‘peering’ in the service name is purely cosmetic – the outcome is a provider service without third party transit) • May use a ‘settlement metric’ • (again the term is normally cosmetic – in most cases it can be regarded as a conventional service tariff)
End User End User End User End User End User End User End User End User End User End User End User End User End User End User End User End User Exchange ISP ISP ISP ISP ISP ISP ISP Exchange Exchange Exchange Non-Hierarchical Evolution:Today’s Internet
Internet ‘Shape’ • The network is becoming less ‘stringy’ and more densely interconnected • i.e. Transit depth is getting smaller Distance Distance Span Span
Internet ‘Shape” • The network is becoming less strictly hierarchical • Regional ‘globbing’ is evident • Multi-point interconnection is widely used
Interconnection Trends • Multiple upstream contracts are commonplace • An open competitive market for upstream transit is evident • Upstream transit services are becoming a commodity service • Substitutability exists through peering • Widespread interconnection is a substitute for a large proportion of upstream services • Deregulation, increasing communications requirements, decreasing unit cost of communications, interconnection marketplaces all make interconnection cheaper • transit service costs are being forced down to match substitution costs • There is some lag in the transit market, opening the opportunity for still further interconnection
The Larger Picture • Communications costs are declining • as a result of technology, deregulation and market response to the changing supply / demand ratios • The network is now more densely interconnected • less relative reliance on a small collection of Tier 1 transit service providers and related financial arrangements • Substitutability exists for hierarchical paid upstream transit services • Through use of peering points, multiple upstream services, wider network reach
The Larger Picture • IP packet transmission is becoming a commodity market with IP transit and circuit services becoming directly comparable • The evolving Internet content market is rapidly becoming the most critical issue in terms of value transfer at a national and international level
The Larger Picture • While the content market is increasing in value, it is important to distinguish value and volume in the context of the content market. • High volume, replicated content has a low unit value to individual consumers • Point-to-point individual services, while low volume, represent the highest value segment of the content market • As evidenced by the rise of SMS volumes as compared to call minutes on mobile phone networks • Volume is not the same as Value in the Inter-Provider Internet