Download
1 / 34
340 likes | 361 Views
Comprehensive exploration of internal seismic isolation (ISI) systems within LIGO, focusing on measurements, modeling, suspensions, and controls for improved system efficiency and reliability.

E N D
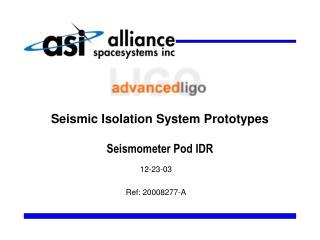
System Identification for LIGO Seismic Isolation Brett Shapiro GWADW – 19 May 2015 G1500644-v1
Contents • Internal Seismic Isolation (ISI) • Measurements • Modeling • Suspensions • Measurements • Modeling G1500644-v1
Internal Seismic Isolation (ISI) G1500644-v1
BSC chamber (core optics) configuration and performance Pier Pier Ground From G1401207
Where stuff is on a BSC-ISI STAGE 2 (ST2) STAGE 1 (ST1) STAGE 0 (ST0) GS13 T240 ACT L4C f = ~1 Hz CPS Electromagnetic Inertial Sensor One corner’s ST0-1 and ST1-2 position sensors and actuators f = ~1 Hz f = ~5 mHz Displacement Actuators Jeffrey Kissel, MIT Dec 11th 2009 Inertial Sensors Sensor
Schroeder Phase TFs • The excitation consists of a frequency comb with a spacing of Δf • The phase of each sine wave is set to minimize the largest excitation value • All within MATLAB Excitation spectrum Δf Amplitude Frequency
Example TF from BSC-ISI 100 Hz – 500 Hz measurement 10 Hz – 100 Hz measurement 0.1 Hz - 0.7 Hz measurement 0.7 Hz – 10 Hz measurement
Example TF from BSC-ISI The measured transfer functions are also useful as models
Model fit to Measurements Fit using MATLAB’s N4SID – frequency domain or time domain. Generates state space model.
Suspensions G1500644-v1
Quadruple Suspension (Quad) • Purpose • Input Test Mass (ITM, TCP) • End Test Mass (ETM, ERM) • Location • End Test Masses, Input Test Masses Reaction Chain Main (test) Chain R0, M0 • Control • Local – damping at M0, R0 • Global – LSC & ASC at all 4 • Sensors/Actuators • BOSEMs at M0, R0, L1 • AOSEMs at L2 • Optical levers and interf. sigs. at L3 • Electrostatic drive (ESD) at L3 • Documentation • Final design review - T1000286 • Controls arrang. – E1000617 L1 L2 L3 19 May 2015 - GWADW- G1500644
SUS Schroeder Phase Transfer Functions • Consistent performance for suspensions between testing phases and sites • Allows comparison of the “as-built” suspension resonances against an analytical model of the mechanics • To give us confidence that the suspension works as designed • Aiming for repeatability for suspensions throughout all Phases of testing • Also want to maintain repeatability from site to site HSTS Ref - G1300132
Testing - Transfer Functions Find Bugs • Help diagnose when something has gone wrong e.g. identify rubbing source • PR2 showed no signs of rubbing during Phase 3a (free-air) • But following pump-down, Phase 3b, only PR2 shows severe rubbing (orange) • After venting, still exhibited identical vertical rubbing, suggesting no t buoyancy related (T1100616) • Visual inspection identified it to be a lower blade stop interfering HSTS Lower blade-stop Ref - G1300132
Suspension Model Parameter Estimation G1500644-v1
Model vs Measurement Top Mass Pitch to Pitch Transfer Function: Before fit
Error Measurement Top Mass Pitch to Pitch Transfer Function: Before fit Error = difference in mode freq • High Q resonant frequency measurements are not subject to calibration errors or noise. • The measurement ‘noise’ is the data resolution, which only depends on time.
Maximizing the Measurements 2nd highest stage locked 2nd lowest stage locked Top locked All free 18 resonances 24 resonances 6 resonances 12 resonances 6 + 12 + 18 + 24 = 60 resonant frequencies
Quad Model – 67 unique parameters Front Side
Quad Model – 67 unique parameters Physical parameters include: Inertia Spring stiffness Wire dimensions … Etc… Front Side
Before Parameter Estimation Top Mass Pitch to Pitch Transfer Function: Before fit
After Parameter Estimation Top Mass Pitch to Pitch Transfer Function: After fit References: T1000458 and “Selection of Important Parameters Using Uncertainty and Sensitivity Analysis”, Shapiro et al.
Parameter Estimation Can Diagnose Errors Wrong optic wire diameter • All DOFs for SRM (HSTS) looked good, except for an ugly feature in Pitch (orange) • Modeling suggested that most likely the incorrect diameter lower wire could be the culprit (see LLO aLOG4766i.e ø = 152 μm instead of ø = 120 μm • This was later confirmed, and replaced with the correct wire diameter (magenta) HSTS Measuring lower wire diameter Ref - G1300132
Model Misses Cross-Couplings Frequency (Hz)
Homework: find ways to improve measurements of future suspensions • Examples • More sensors & actuators • Different dynamics • e.g. lower bounce mode frequency • Many solutions will help bothsys-id and control
Model Misses Cross-Couplings Frequency (Hz)
Model Misses Cross-Couplings Frequency (Hz)
SEI Sensors and Their Noise “Low” Frequency CPS MicroSense’s Capacitive Displacement Sensors Used On: HAM-ISIs and BSC-ISIs Used For: ≤ 0.5 Hz Control, Static Alignment Used ‘cause: Good Noise, UHV compatible IPS Kaman’s Inductive Position Sensors Used On: HEPIs Used For: ≤ 0.5 Hz Control, Static Alignment Used ‘cause: Reasonable Noise, Long Range DC 10 mHz T240 Nanometric’s Trillium 240 Used On: BSC-ISIs Used For: 0.01 ≤ f ≤ 1Hz Control Used ‘cause: Like STS-2s, Triaxial, no locking mechasim -> podded STS2 Strekheisen’s STS-2 Used On: HEPIs Used For: 0.01 ≤ f ≤ 1Hz Control Used ‘cause: Best in the ‘Biz below 1 Hz, Triaxial 1 Hz GS13 GeoTech’s GS-13 Used On: HAM-ISIs and BSC-ISIs Used For: ≥ 0.5 Hz Control Used ‘cause: awesome noise above 1Hz, no locking mechanism -> podded L4C Sercel’s L4-C Used On: All Systems Used For: ≥ 0.5 Hz Control Used ’cause: Good Noise, Cheap, no locking mechanism -> podded 800 Hz “High” Frequency J. Kissel, Apr 7 2011
SEI Sensors and Their Noise J. Kissel, Apr 7 2011
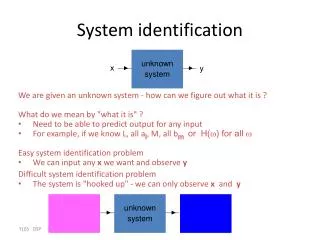
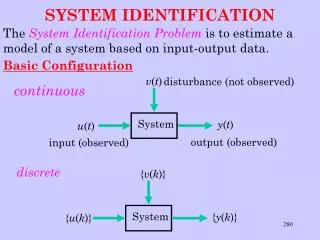
What is System Identification? “System Identification deals with the problem of building mathematical models of dynamical systems based on observeddata from the system.” - LennartLjung, System Identification: Theory for the User, 2nd Ed, page 1.
References • LennartLjung, System Identification: Theory for the User, 2ndEd • DariuszUcinski, Optimal Measurement Methods for Distributed Parameter System Identification