Sensitivity Analysis and Explanation Facilities in CI Systems
230 likes | 259 Views
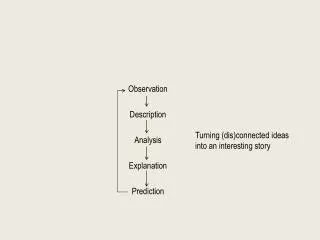
Learn how sensitivity analysis methods like Zurada sensitivity analysis and relation factors assess CI system inputs' importance. Explore Hinton diagrams and applications in explanation facilities.

Sensitivity Analysis and Explanation Facilities in CI Systems
E N D
Presentation Transcript
Chapter 11 Outline • Explain how CI systems do what they do • Only a few methodologies are discussed here • Sensitivity analysis • Relation factors • Zurada sensitivity analysis • Hinton diagrams • Applications of EC to explanation facilities
Sensitivity Analysis • Provides a method for assessing relative importance of CI system inputs • One definition is true positive ratio: TP/(TP+FN) • Another approach is that of relation factors, which depict strengths between individual inputs and individual outputs of a CI system • Still another approach is the Zurada sensitivity analysis, designed originally for neural networks
Relation Factor One Relation factor one: Effect of a given input on a given output when other inputs are held constant (often 0); switch input over dynamic range (0–1 for NN, dynamic range for fuzzy system) With i inputs and o outputs, there are i * o relation factors one Can clamp values to something other than 0, say 0.5 (or the midpoint of the dynamic range, for fuzzy systems).
Relation Factor Two • Measures average effect of given input on given output over a set of patterns • For each pattern, calculate the change in the output when the input is switched over its range while other inputs have value defined by the pattern • Repeat for all patterns • Sum of changes divided by number of patterns gives the factor for a given input-output pair • Again, there are i * o such factors • Can use relation factors to make CI system more intelligent about what input is requested next
Zurada Sensitivity Analysis The sensitivity of a trained output zkj with respect to an input aki is defined as The sensitivity must therefore be determined for each input for each pattern, resulting in a sensitivity matrix.
Zurada Sensitivity Three sensitivity measures are defined over the entire training set: The mean square average sensitivity matrix Savgis defined as: The absolute value average sensitivity matrix Sabsis defined as: The maximum sensitivity matrix Smaxis defined as:
Zurada Sensitivity, Simplified • Calculate mean value for each input parameter • Hold all but 1 input at mean, vary other over dynamic range in steps (10-15 steps), then iterate for each input. • Sensitivity of an input with respect to an output is max – min over this range of inputs: Sji,e • Calculate a sensitivity for each input Si,e in one of three ways.
Zurada Sensitivity, Simplified Now calculate a sensitivity for each input in one of three ways: The mean square average estimated sensitivitySi,eavis defined as: The absolute value average estimated sensitivitySi,eabis defined as: The maximum estimated sensitivity Si,emxis defined as:
Using Zurada Sensitivities • Rank order sensitivities • Delete input with lowest sensitivity and retrain network • If results are good, keep result and try deleting another input • More scientific approach: • Retrain network with a random variable as an additional input • Calculate Zurada sensitivities • Remove any input with sensitivity lower that that of random input • Retrain (without random input) • Same method can be adapted for fuzzy systems
Hinton Diagrams Must exercise care when interpreting weights in a neural network (large weights aren’t always important) Numeric representations of weight matrixes are difficult to interpret Geoffrey Hinton developed a graphical representation technique Size of shape is magnitude of weight Color or shading represents sign In Figure, a 9-4-2 backprop net weight matrix is shown Input to hidden weights on top Hidden to output weights on bottom Bias weights on left A number of variations exist (activation values can be displayed, for example; can be used to prune networks
EC Tools for Explanation Facilities • Explanation facilities make CI systems understandable to users • Explanation facilities should have consistent user interfaces • Functions can include: • Cite reasons for decision • Make system actions clear • Provide examples • Cite logical relationships
Explanation Facility Justification • Main justification often is to provide reasons for system conclusions • Also sometimes justified by need for info on: • System limitations • System knowledge domain(s) • Codebook vectors • Decision hypersurface information • The bottom line is that the user wants to TRUST the system!
Explanation Facility Design and Functions • Design of interface important • Design should be responsive to level of users, especially novices • Trace functions used mainly for debugging • NN explanation facilities can provide user with “codebook vectors” • which are quintessential examples (online or offline) • NN facilites can also provide information on decision hypersurface including distance to it • Fuzzy System facilities can list rules that fired, ranked by contribution
Explanation Facility Shortcomings • Sequence of rule firings not intuitive for many users • Typical backward chaining system doesn’t give information on decision hypersurface • Some explanation facilities require rule firing information • Systems that have parallel aspects, such as evolutionary fuzzy expert systems, present special challenges
Evolutionary Computation Tools • Use trained NN weight matrix to calculate fitness and EA to find input patterns that illustrate: • Codebook vectors • Decision hypersurface • Some kind of rank ordering of EA is often beneficial • Fuzzy systems can also act as fitness functions
Modular Approach to Explanation Facilities • “Look and feel” should be consistent among modules despite using codebook vectors, relation factors, etc. • A (fuzzy) rule-based shell can provide a common interface and consistency
Modular Medical Diagnostic System Could represent three main modules: abdominal disorders, chest pain, and ocular complaints.
Example Neural Network Explanation Facility Uses particle swarm optimization Works on the Iris data set Can be used with any back-propagation neural net weight file obtained using the back-propagation implementation in this book Run it by invoking the program with two run files: nnexp bp.run pso.run
PSO Run File Similar to that for the evolutionary NN application Example: 1 0 1 0 0 = minimize 18 Use evaluation function 18 1 1 0.0 1.0 0.5 1.0 1000 30 0.9 0
BP.RUNExample iris.wts neural network weight file 3number of layers in NN 4number of PE in hidden layer 4 number of network inputs 3number of network outputs 0.9 0.1 0.1what you are looking for examples of 0.011acceptable sum-squared error irisexp.outresults file for output Note: Don’t use 1 and 0 as your targets with a sigmoidal activation function.
Sample Output Format: inp1 inp2 inp3 inp4 targval1 targval2 targval3 error 0.18607 0.37378 0.29725 0.15496 0.90000 0.10000 0.10000 0.010015 To get values near the decision hypersurface for classes 2 and 3, use target values of: 0.1 0.5 0.5