Download
1 / 32
320 likes | 338 Views
This study analyzes the Maryland Biological Stream Survey (MBSS) and the Stream Waders programs to evaluate data comparability at different scales. Results show similarities, especially at smaller scales, and differences in site ratings. The findings suggest using both programs' data for comprehensive watershed assessments and highlight the need for further investigation into discrepancies observed.

E N D
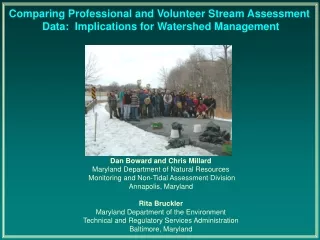
Comparing Professional and Volunteer Stream Assessment Data: Implications for Watershed Management Dan Bowardand Chris Millard Maryland Department of Natural Resources Monitoring and Non-Tidal Assessment Division Annapolis, Maryland Rita Bruckler Maryland Department of the Environment Technical and Regulatory Services Administration Baltimore, Maryland
The Maryland Stream Waders... Volunteer Branch of the Maryland Biological Stream Survey (MBSS) • Encourage local action • Support grassroots efforts (e.g, non-profit and • watershed groups) • Educate and involve the public • Fill data gaps
MBSS sampling at each site consists of… • Fish • Benthic Macroinvertebrates • Amphibians and Reptiles • Physical Habitat • Water Chemistry • Land Use
21 MBSS sites Liberty Watershed, 2000
21 MBSS sites • 17 (12-digit) sub-watershed Liberty Watershed, 2000
21 MBSS sites • 17 (12-digit) sub-watershed • 10 sub-watersheds have no sites Liberty Watershed, 2000
MBSS site Stream Waders site Liberty Watershed, 2000 • 21 MBSS sites • 17 (12-digit) subwatershed • 10 subwatersheds have no sites • Add 40 Stream Waders sites • Only 3 sub-watersheds have no data
How do they Compare? MBSS Stream Waders Random 70 mi2 watershed Yes Yes Yes Spring; D net; multihabitat; 20 ft2; lab subsample and ID Genus Delineate upstream Targeted 8 mi2 sub-watershed No No Depth and Width Spring; D net; multihabitat; 20 ft2; lab subsample and ID Family 1 km radius circle Design Scale Fish Water Chemistry Physical Habitat Benthic Macroinvertebrates Taxonomy Land Use/Land Cover
Stream Waders Training • Classroom review of protocols • Field session practice • Includes lots of professionals and “repeat customers”
Questions • How comparable are Stream Waders and MBSS data (IBIs) at different scales?
Questions • How comparable are Stream Waders and MBSS data (IBIs) at different scales? • How do family and genus IBIs computed from the same site/taxa dataset compare? • What are differences in the two sets of IBIs by sample year? • How do the two programs rate stream sites?
Statewide • Stream Waders – 2755 sites • MBSS – 1336 sites
MBSS Genus and Family IBI Same Samples r=0.84 Mean difference in Genus IBI less Family IBI = 0.12
% of sites % of sites % of sites
Stream Waders and MBSS Statewide – Number of Families per Sample
Stream Waders and MBSS Statewide – Number of EPT Families per Sample
Number of Grids 100 Organism Subsample
Watershed • Stream Waders - mean = 26.6; range = 1 - 116 • MBSS - mean = 9.2; range = 1 - 41 **124/137 watershed sampled by both programs
Watershed MBSS-genus IBI less Stream Waders IBI P=0.1003 P=0.0638
Watershed 124 Watersheds; all years combined Stream Waders mean IBI Not Degraded MBSS-Genus mean IBI Degraded Degraded Not Degraded 71% 29% 22% 78% 73% agreement on degraded/not degraded
Sub-watershed • Stream Waders - mean = 4.1; range = 1 - 26 • MBSS - mean = 2.2; range = 1 - 31 **380 sub-watersheds sampled by both programs
Sub-watershed 374 sub-watersheds; all years combined Stream Waders mean IBI MBSS-Family mean IBI Not Degraded Not Degraded MBSS-Genus mean IBI Degraded Degraded Degraded Not Degraded 70% 23% 82% 14% 30% 77% 18% 86% 72% agreement on degraded/not degraded 84% agreement on degraded/not degraded
Stream Reach • 452 sites with at least one site from each program • 16 reaches with two sites from each program
N = 118 pairs Grand Mean=0.53 N = 172 pairs Grand Mean=0.74 Stream Reaches Within Program Site Pairs
Between Programs Within Program MBSS genus/SW MBSS family/SW MBSS genus/MBSS genus SW/SW Stream Reaches Agreement on Degraded/Not Degraded
Duplicate Samples • Stream Waders – 109 pairs • MBSS – 71 pairs
84% agree on "Degraded" 83% agree on "Degraded" MBSS and Stream Waders Duplicate Samples Original – Dup = -0.16 N=109 r=0.76 83% agree on impairment Original – Dup = -0.03
Conclusions • Stream Waders and MBSS data are comparable, especially at smaller scales. • Family IBIs tend to rate sites as more degraded than genus IBIs. • Stream Waders data should be used to support those collected by MBSS in watershed assessments. • Next steps…. • Examine causes for differences • D.E.: MBSS - CP = 87% • NCP = 88% • SW - CP = 71% • - NCP = 88% • Do this all over again with revised IBIs!