Download
1 / 11
110 likes | 128 Views
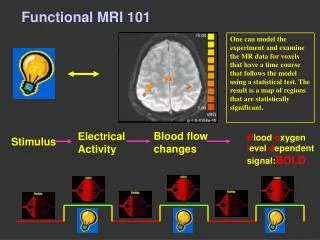
This study aims to characterize stroke motor recovery using structural and functional MRI connectivity imaging. The study examines 31 patients with acute ischemic stroke and 20 healthy controls, evaluating motor behavior, functional connectivity, and structural connectivity over time. The findings suggest that stroke causes changes to the corticospinal tract microstructure, and fractional anisotropy of the corticospinal tract can improve the prediction of motor outcome based on acute motor scores.

E N D
Characterizing stroke motor recovery by structural and functional MRI L.Y. Lin, L.E. Ramsey, N.V. Metcalf, J. Rengachary, G.L. Shulman, J.S. Shimony, M. Corbetta ASNR 2015; Poster # EP-22
Background • Patients who suffered stroke affecting CST and motor network often have acute loss of motor function on contralateral side with gradual recovery that varies greatly between patients • Traditionally prognosis is determined by clinical factors such as age, education, and initial neurological deficits • We aim to characterize stroke recovery with structural and functional connectivity imaging.
Patients • Subjects • 31 patients with acute ischemic stroke (lesion distribution: 13 cortical, 4 cortical-subcortical, 11 subcortical, 1 cerebella, 2 other) • Patients characteristics: mean age 52.8 (range 22-77), 29 right handed, 14 female • 20 healthy age matched controls • Follow-up: Stroke patients were evaluated with motor tests at recruitment (within 4 weeks after stroke), 3 months after stroke, and a year after stroke. At these time points, fMRI was taken to get BOLD data. DTI scans were obtained at 3 months and one year post stroke.
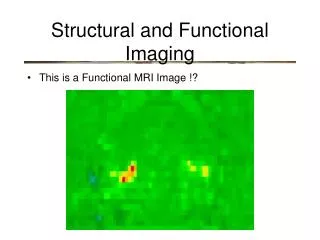
Methods • Motor behavior was characterized by the factor score which is based on factor analysis of shoulder flexion, wrist extension, hand dynameter, nine hole peg, action research arm test, timed walk, motoricity, and ankle flexion • Functional connectivity (FC) was characterized by the correlation of the homotopic pairs of seed regions in the motor network by the BOLD signal • Structural connectivity of the CST was characterized by the average FA value obtained from DTI • ANOVAs were used to test for changes in FC, FA, and motor behavior scores over time • Regression analysis related motor outcome to clinical and neuroimaging variables
Color scale of lesion locations with red representing one patient with lesion at that location and yellow representing six. The cortical spinal tract is in teal. Table shows number of patients at each lesion location. Control This graph shows the motor factor scores over time in all three groups. The improvement of contralateral motor factor scores is more notable than the ipsilateral motor factor scores. Ipsilateral Motor Factor Score Contralateral Acute 3 mo 12 mo
Imaging changes over time B Control BOLD Homotopic A Stroke subjects Control Acute 3 mo 12 mo Contralesional Fractional anisotropy Graphs show FA (A) and BOLD homotopic (B) values at each time point. There is a significant interaction between time and side with FA (p=0.0039 on two factor ANOVA). For BOLD homotopic values, there is improvement in homotopic connectivity in the first three months, but not between three and twelve months. Ipsilesional Acute 3 mo 12 mo
Diffusion FA vs. Factor Score A B C D Graphs show the correlation between the FA of the CST outside of the lesion and the motor factor score of the corresponding side at 3 months and 12 months. The correlation of FA to factor score is significant on the abnormal side, and has a wider range of values than the normal side. R2 = 0.5934 p-value = 4.0189e-007 R2 = 0.080756 p-value = 0.1213 Ipsilateral motor factor score 12 months 3 months Contralateral motor factor score R2 = 0.63606 p-value = 7.8058e-008 R2 = 0.051144 p-value = 0.22121 Contralesional FA Ipsilesional FA
BOLD homotopic vs. Factor Score Acute 3 mo A B Contralateral motor factor score 12 mo C Graphs show the correlation between the BOLD homotopic connectivity of the SMN and the motor factor score of the corresponding side at recruitment (acute) and 12 months. The correlation of FA to factor score is significant at the acute time period only. BOLD Homotopic
Multivariable Linear Regression Predicting 12 month Factor Score This table shows p-value of each model. In the all inclusive model, only acute motor factor score and FA ratio are significant predictors of motor factor score at one year post stroke.
Conclusions • Stroke causes changes to the CST microstructure that can account for behavioral variability even in the absence of demonstrable lesion within the CST • Ipsilesional CST undergoes remodeling post-stroke, even past the three-month window when most of the motor recovery happens • FA of the CST, but not inter-hemispheric FC, can improve the prediction of motor outcome based on acute motor scores
Acknowledgements This work was supported by a grant from the Doris Duke Charitable Foundation to Washington University to fund Doris Duke Clinical Research Fellow Leanne Lin.Dr. Shimony & Dr. Corbetta for being the PI’s in the project People who helped me Lenny Ramsey Nick Metcalf Jennifer Rengachary Dr. Gordon Shulman Contact & References