Download
1 / 55
590 likes | 724 Views
This study explores the thermodynamic properties of semi-perfluorinated amphiphilic compounds that form liquid crystals. We present a comparison of calculated and experimental total phase change entropies, emphasizing the differences in entropy values for these materials. The work highlights the significance of liquid crystalline behavior, first discovered in 1888, and its applications across various classes of compounds. The investigation utilizes Differential Scanning Calorimetry (DSC) to analyze thermal transitions, revealing the complex thermal behavior and phase changes in liquid crystalline substances.

E N D
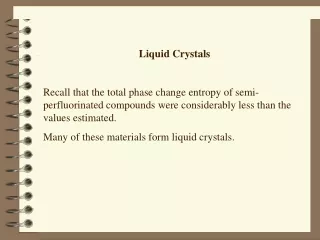
Liquid Crystals Recall that the total phase change entropy of semi-perfluorinated compounds were considerably less than the values estimated. Many of these materials form liquid crystals.
Table. Molar Transition Enthalpies (kJ mol-1) and Entropies (J mol-1 K-1) of Select Amphiphilic Semiperfluorinated-Semiper-hydrogenated Diblock and Triblock Organic Compoundsa T(K) HpceSpceStpce 0.6StcpeStcpe HtpceHtpce expt calcd calcd expt calcd UNSUBSTITUTED DIBLOCK MOLECULES C16H9F25 F3C(CF2)11(CH2)4H 147.0 0.7 5 314.0 1.4 4 349.0 21.0 61 69.4 57.1 93.6 23.1 19.9 C16H13F21 F3C(CF2)9(CH2)6H 306.0 4.2 14 318.0 16.9 53 67 61.6 100.9 21.1 19.6 C16H17F17F3C(CF2)7(CH2)8H 301.2 9.5 31.6 303.2 5.7 18.8 50.3 90.2 147.9 15.2 27.3 C17H21F15 (CF3)2CF(CF2)4(CH2)10H 220.0 3 13.6 261.0 18 69.0 82.6 84.6 138.6 21.0 18.9
T(K) HpceSpceStpce 0.6StcpeStcpe HtpceHtpce expt calcd calcd expt calcd C18H13F25 F3C(CF2)11(CH2)6H 164.0 0.5 1 316.0 3.5 11 357.0 23.4 65.5 79.7 65.7 107.8 27.4 23.5 C18H21F17 F3C(CF2)7(CH2)10H 288.0 3.5 12 308.0 20.2 65 77.7 86.8 142.3 23.7 26.9 C19H21F19 (CF3)2CF(CF2)6(CH2)10H 274.0 1 3.6 298.0 25 83.9 87.5 84.6 138.6 26 22.1 C20H17F25 F3C(CF2)11(CH2)8H 192.0 2.4 12.5 329.0 6.4 19.5 361.0 23.7 65.7 97.6 74.7 122 32.5 26.9 C20H21F21 F3C(CF2)9(CH2)10H 317.0 4.0 12 337.0 24.4 72 85 78.9 129.3 28.4 26.6
Figure. A comparison of calculated and experimental total phase change entropies for the partially fluorinated amphiphilic compounds.
Stcpe(calcd) = (0.6480.06) Stcpe expt+ (30.113.5); r2 = 0.6525
Liquid Crystals Since their first discovery back in 1888, interest in the properties and practical applications of liquid crystals has increased dramatically.1,2 General acceptance of liquid crystals as a distinct phase of matter was slow, occurring some 30 years since they were first reported. Liquid crystalline behavior is found among numerous classes of compounds that include biphenyls, cholesterol esters, soaps, lipids, polymers and elastomers. More than 76000 compounds have been identified as exhibiting liquid crystalline behavior.
Between 1850 and 1888, researchers found that several materials behaved strangely at temperatures near their melting points. It was observed that the optical properties of these materials changed discontinously with increasing temperatures. W. Heintz, for example, reported in 1850 that stearin melted from a solid to a cloudy liquid at 52°C, changed at 58°C to an opaque and at 62.5°C to a clear liquid. Others reported observing blue colors when cholesterol esters were cooled. Biologists observed anisotropic optical behavior in "liquid" biological materials, a behavior usually expected only in the crystal phase.
In 1888, an Austrian botanist named Friedrich Reinitzer, interested in the biological function of cholesterol in plants, was looking at the melting behaviour of an organic substance related to cholesterol. (The chemical structure of cholesterol was still unknown. Today we know that the observed substance was cholesteryl benzoate). He observed, as W. Heintz did with stearin 38 years before, that the substance melted to a cloudy liquid at 145.5°C and became a clear liquid at 178.5°C. He repeated an earlier observation which showed that upon cooling the clear liquid, a brief appearance of blue color could be seen at the transition temperature, and that a blue violet color appeared just before crystallization from: http://www.lci.kent.edu/lc_history.html
An examination of the phase change enthalpies of liquid crystals reveals that these substances exhibit several thermal transitions that can be detected. For most substances, the largest enthalpic change occurs upon conversion of the solid to a nematic or smectic phase. DSC is a common way of studying the thermal behavior of liquid crystals
In the most popular DSC design, two pans sit on a pair of identically positioned platforms connected to a furnace by a common heat flow path. In one pan, you put your sample. The other one is the reference pan. You place an MT cell. You then program the computer to turn on the furnace to heat the two pans at a specific rate, usually something like 5oC per minute. If heat is adsorbed or emitted, the power supplied to maintain a constant temperature is measured.
Figure. DSC trace of a typical compounds exhibiting liquid crystal formation.
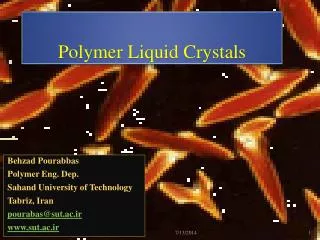
Schlieren texture of a nematic film with surface point defects (boojums). This picture was taken under a polarization microscope with polarizer and analyzer crossed. From every point defect emerge four dark brushes. For these directions the director is parallel either to the polarizer or to the analyzer. The colors are newton colors of thin films and depend on the thickness of the sample. Point defects can only exist in pairs. One can see two types of boojuns with "opposite sign of topological charge"; one type with yellow and red brushes, the other kind not that colorful. The difference in appearance is due to different core structures for these defects of different "charge".
C14H30O4 CH2OHCHOH(CH2)10CHOHCH2OH tpceSm(exp) = 131.3 J mol-1.K-1; tpceSm (calc) = 176.6 J mol-1.K-1 tpceSm(calc) = 2(7.1)+2(16.4)(0.6)+2(1.7)(13.1)+10(1.31)(7.1) C20H28O3 tpceSm(exp) = 82.7 J mol-1.K-1; tpceSm (calc) = 107.9 J mol-1.K-1 (calc) =2*17.6+3*7.1+33.4+3*3.7+2*(-14.7) +5.3*0.75 +5.3 +4*7.4+2(-7.5)+7.7+ 4.7
Fig. A comparison of the experimental and calculated total phase change entropies of 2637 compounds. The area between the two lines represents 2 .
Fig. A comparison of calculated and experimental values for 627 liquid crystals. The solid line represents the equation obtained by a linear regression analysis and the area within the two dotted lines represents anticipated values of falling within 2 based on the evaluations of database compounds.
Fig. A histogram of the distribution of errors in (exp) - (calc) for liquid crystals. Each interval represents one standard deviation (15.3 J. mol-1.K-1). Six compounds has errors equal to or larger than -30 .
Possible reasons responsible for both the scatter and overestimations observed in Fig. 3. • Some residual molecular association exists at the clearing temperature. • Attenuation in phase change entropies is compensated at some temperature by increases in the heat capacity of the crystal. • Polymorphism may also play a role. • The solid phase may not possess total crystallinity. Studies on polymeric materials have shown that the measured enthalpies of fusion depend on the degree of crystallinity. • Occurrence of undetected solid-solid phase transitions at low temperatures is certainly a possibility.
Table. A series of compound including liquid crystals whose heat capacity and phase transitions of the crystalline phase have been studied over most of the experimentally accessible regiona Transition T/K pceHmpceSmtpceSm (exp) tpceSm(estimated) So (385 K) C36H54O12 benzene hexa-n-pentanoate Sol/Sol 173.1 8.8 50.83 Sol/Sol 313.2 15.3 48.85 Sol/Liq 379.5 30.3 79.84 183.5 234.6 1629.9 C42H66O12 benzene hexa-n-hexanoate Sol/Sol 251.6 25.67 102.0 Sol/Sol 291.5 12.27 42.1 Sol/Sol 348.3 16.26 46.7 Sol/Liq 368.7 33.50 90.9 281.7 277 1877.1 C48H78O12 benzene hexa-n-heptanoate Sol/Sol 129 1.1 8.5 Sol/Meso 353.8 32.2 91.1 Meso/Liq 359.3 21.5 59.9 159.5 319.8 2114.4 C54H90O12 benzene hexa-n-octanoate Sol/Sol 301.9 49.0 164.0 Sol/Meso 355.1 46.1 129.8 Meso/Liq 357.1 19.2 53.8 347.6 362.4 2361.3 C60H102O12 benzene hexa-n-nonanoate Sol/Sol 248.3 19.4 78.13 Sol/Sol 278.3 4.9 17.60 Sol/Liq 353.1 69.2 195.98 291.7 405 2597.8 Liq/Meso 350 NA C66H114O12 benzene hexa-n-decanoate Sol/Sol 330.8 75.7 228.9 Sol/Liq 360.9 91.8 254.3 483.2 448 2861.5 aCp measurements of the solid from approximately 15 K to the isotropic liquid at 385 K.
Recall that So = + pceH/T + + fusH/Tfus + … So evaluated from 15 K to 385 K • M. Sorai, K. Tsuji, H. Suga and S. Seki, Mol. Cryst. Liq. Cryst., 80, 33-58 (1980). • M. Sorai and H. Suga, Mol. Cryst. Liq. Cryst., 73, 47-69 (1981).12. M. Sorai, H. Yoshioka and H. Suga, Mol. Cryst. Liq. Cryst., 84, 39-54 (1982). • S. Asahina and M. Sorai, J. Chem. Thermodyn., 35, 649-666 (2003). • S. Asahina, and M. Sorai, Liq Cryst., 28, 1085-1092 (2001).
Fig. A plot of the entropy of the benzene hexa-n-alkanoates at T = 385 K as a function of the number of carbon atoms.
The pentanoate, hexanoate and decanoate do not form liquid crystals. The nonanoate does so only on supercooling the isotropic liquid below the melting temperature. Both the heptanoate and octanoate form liquid crystals. Agreement between estimated and experimental total phase change entropies is within the noise level expected for these estimations for the pentanoate, hexanoate, octanoate and decanoate. Values for the heptanoate and nonanoate are clearly overestimated. Even for the octanoate, although the two values are within experimental uncertainty, the calculated value is somewhat larger.
Conclusions • Deviations not due to residual molecular association existing at the clearing temperature. • Effects due to polymorphism not likely. • The solid phase is crystalline. • Undetected phase transitions are not responsible. • Attenuation in phase change entropies is compensated at some temperatures by “abnormal” increases in the heat capacity of the crystal.
Definition of Tfus, Tclr and Tisofor Liquid Crystals Tfus = melting temperature Tclr = temperature at which the liquid crystal clears; for some samples, this could below Tfus if thesample supercools Tiso = temperature at which the liquid crystal becomes isotropic; for most compounds also equal to Tclr Tiso = Tisomax()[1- 1/(mN + b)] for increasing Tf (n) Tiso = Tiso min/ [1- 1/(mN + b)] for decreasing Tf (n)
Question: How do the melting temperatures of liquid crystals compare to the melting temperatures of analogous compounds that do not form liquid crystals?
Figure. Circles: melting temperatures or temperatures at which the trans-4-n-alkoxy-3-chlorocinnamic acids becomes isotropic; squares are melting temperatures for compounds forming liquid crystals; triangles: smectic to nematic transitions
Figure. A plot of 1/[1-T()/T(n)] versus the number of methylene groups for trans-4-n-alkoxy-3-chlorocinnamic acids. The solid circles represent melting temperatures, the solid squares represent nematic to isotropic transitions, the circles represent smectic to nematic transitions and the squares represent from nematic to isotropic transitions. The temperatures at which the liquids become isotropic appear to correlate best. A value of 380 K was used for T().
Tfus (n)= 317/ [1- 1/((0.564)n + 5.133)]; r2 = 0.6586 Tiso (n) = 234/ [1- 1/((0.0238)n + 2.528)]; r2 = 0.9661 Fig. A comparison of the melting and clearing temperatures of the thiocholesteryl n-alkanoates (odd series); circles: melting temperatures; squares: clearing temperatures. The first and third compounds in the series do not form liquid crystals.16
Tfus (n)= 259/ [1- 1/((0.0745)n + 3.065)]; r2 = 0.7508 Tiso (n) = 328/ [1- 1/((0.4185)n + 5.436)]; r2 = 0.9931 Fig. A comparison of the melting and clearing temperatures of the thiocholesteryl n-alkanoates (even series); circles: melting temperatures; squares: clearing temperatures
It appears that the melting temperature correlates best with the temperature at which the liquid crystals become isotropic. This means that the temperature at which the solid melts is lowered as a result of formation of the smectic or nematic phase. Why is there a melting point lowering? Why do impure materials melt lower than pure materials?
Tiso = Tiso min/ [1- 1/(mN + b)] for decreasing Tf (n) Tfus (n)= 317/ [1- 1/((0.564)n + 5.133)]; r2 = 0.6586 Tiso (n) = 234/ [1- 1/((0.0238)n + 2.528)]; r2 = 0.9661 Tfus (n)= 259/ [1- 1/((0.0745)n + 3.065)]; r2 = 0.7508 Tiso (n) = 328/ [1- 1/((0.4185)n + 5.436)]; r2 = 0.9931 Question: How was Tiso min determined for each of these series?
Ans: 1/[1- Tiso min/T(n)] was plotted against n using Tiso min, as a variable. The best value of Tiso min was chosen on the basis of a non-linear least squares program.
Binary phase diagram mp 100 %A 0 %A 0% B 100%B
Packing of the solid in series that form liquid crystals is affected much like the presence of an impurity.
What happens when the descending portion of the Tiso is reached?
A portion of the melting behavior expected of a homologous series after the minimum is reached. The members of the series exhibiting liquid crystalline behavior occur on the descending portion of the curve. Liquid crystalline behavior appears to cease before the minimum. Once the minimum is reached, the melting temperatures are predicted to increase gradually to T = 411 K. Fig. A comparison of the melting and clearing temperatures of the alkyl 4’-methoxybiphenyl-4-carboxylates (odd series); circles: melting temperatures; squares: clearing temperatures. The first two and last entries do not form liquid crystals.
Table Group values for estimating heat capacities of solids at T = 298 K GroupValuesab GroupValuesabHydrocarbon Groups (c) (c) primary sp3 C 36.6 tertiary aromatic sp2 C 17.5 secondary sp3 C 26.9 quaternary aromatic sp2 C 8.5 tertiary sp3 C 9.0 internal quaternary aromatic sp2 C [9.1]quaternary sp3 C -4.98 cyclic secondary sp3 C 24.6 secondary sp2 C [46.0] cyclic tertiary sp3 C 11.7 tertiary sp2 C 21.4 cyclic quaternary sp3 C 6.1 quaternary sp2 C [6.86] cyclic tertiary sp2 C 15.9 tertiary sp C [23.9] cyclic quaternary sp2 C [4.73] quaternary sp C [15.2]
Functional Groups alcohols, phenols 23.5 cyclic ether 9.71fluorine [24.8] isocyanate [52.7] chlorine 28.7 nitro group 56.1bromine 32.4 thiols [51.9] nitrile [42.3] primary sp3 N 21.6carboxylic acid 53.1 secondary sp3 N [-0.29] aldehyde [84.5] tertiary sp3 N [31.5] ketones [28.0] tertiary sp2 N 10.7 cyclic ketones 34.3 cyclic secondary sp3 N [23.9]ester 40.3 cyclic tertiary sp3 N 1.21lactone [45.2] cyclic tertiary sp2 N 13.9 ether 49.8 sulfides [116]cyclic sulfides 18.2
Simple dialkyl ethers and n-alkanes do not form liquid crystals. In addition, their heat capacities at T = 298.15 K are generally well modeled by the group values listed in the previous tables. Why is it that dialkyl ethers and n-alkanes do not form liquid crystals and why are the Cp(c) values for these molecules at various temperatures less than the values found for compounds forming liquid crystals? Recall that tpceSm (exp) < tpceSm(estimated) but thatS°m(total) appears to be a linear function in homologous series.
Figure. Melting temperatures of the odd 1-alkenes, n-alkylbenzenes, n-carboxylic acids, N-(2-hydroxyethyl)alkanamides and 1,-dicarboxylic acids versus the number of methylene groups, circles, squares triangles and hexagons: experimental data; lines: calculated results.
The fact that the first few members of the series deviate from the remaining members is explained as a result of a change in packing from one dominated by the functional group or head group to one dominated by the chain. In liquid crystals, this deviation is exaggerated. However, if the packing is dominated by the head group, then the alkyl chains will be packed loosely and their contribution to the heat capacity will be even larger than their normally high value. Why would the contribution of Cp of a loosely packed group be greater than for a more tightly packed group?