Exploring Data
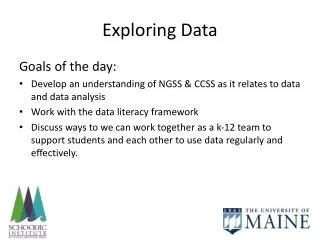
Learn to analyze categorical & quantitative data, construct graphs, interpret distributions, measure center, spread, and more. Understand relationships between variables and use technology for numerical summaries.

Exploring Data
E N D
Presentation Transcript
Data Analysis: Making Sense of Data Learning Objectives After this section, you should be able to… • DEFINE “Individuals” and “Variables” • DISTINGUISH between “Categorical” and “Quantitative” variables • DEFINE “Distribution” • DESCRIBE the idea behind “Inference”
Analyzing Categorical Data Learning Objectives After this section, you should be able to… • CONSTRUCT and INTERPRET bar graphs and pie charts • RECOGNIZE “good” and “bad” graphs • CONSTRUCT and INTERPRET two-way tables • DESCRIBE relationships between two categorical variables • ORGANIZE statistical problems
Displaying Quantitative Data with Graphs Learning Objectives After this section, you should be able to… • CONSTRUCT and INTERPRET dotplots, stemplots, and histograms • DESCRIBE the shape of a distribution • COMPARE distributions • USE histograms wisely
Describing Quantitative Data with Numbers Learning Objectives After this section, you should be able to… • MEASURE center with the mean and median • MEASURE spread with standard deviation and interquartile range • IDENTIFY outliers • CONSTRUCT a boxplot using the five-number summary • CALCULATE numerical summaries with technology
Data Analysis • Statistics is the science of data. • Data Analysis is the process of organizing, displaying, summarizing, and asking questions about data. Definitions: Individuals – objects (people, animals, things) described by a set of data Variable - any characteristic of an individual Categorical Variable – places an individual into one of several groups or categories. Quantitative Variable – takes numerical values for which it makes sense to find an average.
Data Analysis • A variable generally takes on many different values. In data analysis, we are interested in how often a variable takes on each value. Definition: Distribution – tells us what values a variable takes and how often it takes those values Example Dotplot of MPG Distribution Variable of Interest: MPG
How to Explore Data Data Analysis Examine each variable by itself. Then study relationships among the variables. Start with a graph or graphs Add numerical summaries
Analyzing Categorical Data • Categorical Variables place individuals into one of several groups or categories • The values of a categorical variable are labels for the different categories • The distribution of a categorical variable lists the count or percent of individuals who fall into each category. Variable Values Count Percent
Analyzing Categorical Data • Displaying categorical data Frequency tables can be difficult to read. Sometimes is is easier to analyze a distribution by displaying it with a bar graph or pie chart.
Graphs: Good and Bad Analyzing Categorical Data Bar graphs compare several quantities by comparing the heights of bars that represent those quantities. Our eyes react to the area of the bars as well as height. Be sure to make your bars equally wide. Avoid the temptation to replace the bars with pictures for greater appeal…this can be misleading! Alternate Example This ad for DIRECTV has multiple problems. How many can you point out?
Analyzing Categorical Data • Two-Way Tables and Marginal Distributions When a dataset involves two categorical variables, we begin by examining the counts or percents in various categories for one of the variables. Definition: Two-way Table – describes two categorical variables, organizing counts according to a row variable and a column variable. Example, p. 12 What are the variables described by this two-way table? How many young adults were surveyed?
Analyzing Categorical Data • Two-Way Tables and Marginal Distributions Definition: The Marginal Distribution of one of the categorical variables in a two-way table of counts is the distribution of values of that variable among all individuals described by the table. Note: Percents are often more informative than counts, especially when comparing groups of different sizes. To examine a marginal distribution, • Use the data in the table to calculate the marginal distribution (in percents) of the row or column totals. • Make a graph to display the marginal distribution.
Analyzing Categorical Data • Two-Way Tables and Marginal Distributions Examine the marginal distribution of chance of getting rich.
Analyzing Categorical Data • Relationships Between Categorical Variables • Marginal distributions tell us nothing about the relationship between two variables. Definition: A Conditional Distribution of a variable describes the values of that variable among individuals who have a specific value of another variable. To examine or compare conditional distributions, • Select the row(s) or column(s) of interest. • Use the data in the table to calculate the conditional distribution (in percents) of the row(s) or column(s). • Make a graph to display the conditional distribution. • Use a side-by-side bar graph or segmented bar graph to compare distributions.
Analyzing Categorical Data • Two-Way Tables and Conditional Distributions Calculate the conditional distribution of opinion among males. Examine the relationship between gender and opinion.
Displaying Quantitative Data • Dotplots • One of the simplest graphs to construct and interpret is a dotplot. Each data value is shown as a dot above its location on a number line. How to Make a Dotplot • Draw a horizontal axis (a number line) and label it with the variable name. • Scale the axis from the minimum to the maximum value. • Mark a dot above the location on the horizontal axis corresponding to each data value.
Displaying Quantitative Data • Examining the Distribution of a Quantitative Variable • The purpose of a graph is to help us understand the data. After you make a graph, always ask, “What do I see?” How to Examine the Distribution of a Quantitative Variable • In any graph, look for the overall pattern and for striking departures from that pattern. • Describe the overall pattern of a distribution by its: • Shape • Outliers • Center • Spread • Note individual values that fall outside the overall pattern. These departures are called outliers. Don’t forget your SOCS!
Displaying Quantitative Data • Examine this data • The table and dotplot below displays the Environmental Protection Agency’s estimates of highway gas mileage in miles per gallon (MPG) for a sample of 24 model year 2009 midsize cars. Describe the shape, center, and spread of the distribution. Are there any outliers?
Displaying Quantitative Data • Describing Shape • When you describe a distribution’s shape, concentrate on the main features. Look for rough symmetry or clear skewness. Definitions: A distribution is roughly symmetric if the right and left sides of the graph are approximately mirror images of each other. A distribution is skewed to the right (right-skewed) if the right side of the graph (containing the half of the observations with larger values) is much longer than the left side. It is skewed to the left (left-skewed) if the left side of the graph is much longer than the right side. Symmetric Skewed-left Skewed-right
Displaying Quantitative Data • Comparing Distributions • Some of the most interesting statistics questions involve comparing two or more groups. • Always discuss shape, center, spread, and possible outliers whenever you compare distributions of a quantitative variable. Compare the distributions of household size for these two countries. Don’t forget your SOCS! Place U.K South Africa
Displaying Quantitative Data • Stemplots (Stem-and-Leaf Plots) • Another simple graphical display for small data sets is a stemplot. Stemplots give us a quick picture of the distribution while including the actual numerical values. How to Make a Stemplot • Separate each observation into a stem (all but the final digit) and a leaf (the final digit). • Write all possible stems from the smallest to the largest in a vertical column and draw a vertical line to the right of the column. • Write each leaf in the row to the right of its stem. • Arrange the leaves in increasing order out from the stem. • Provide a key that explains in context what the stems and leaves represent.
Displaying Quantitative Data • Stemplots (Stem-and-Leaf Plots) • These data represent the responses of 20 female AP Statistics students to the question, “How many pairs of shoes do you have?” Construct a stemplot. Key: 4|9 represents a female student who reported having 49 pairs of shoes. 1 93335 2 664233 3 1840 4 9 5 0701 1 33359 2 233466 3 0148 4 9 5 0017 1 2 3 4 5 Stems Add leaves Order leaves Add a key
Displaying Quantitative Data • Splitting Stems and Back-to-Back Stemplots • When data values are “bunched up”, we can get a better picture of the distribution by splitting stems. • Two distributions of the same quantitative variable can be compared using a back-to-back stemplot with common stems. Females Males Females 333 95 4332 66 410 8 9 100 7 Males 0 4 0 555677778 1 0000124 1 2 2 2 3 3 58 4 4 5 5 0 0 1 1 2 2 3 3 4 4 5 5 “split stems” Key: 4|9 represents a student who reported having 49 pairs of shoes.
Using the class data, make a Dot Plot and a split stem plot of the ages in months of the students in the class and describe the distribution using the acronym SOCS.
The distribution of ages in months for the class is roughly symmetric and mound shaped with a center about 216 months and a range of 23. The age of 231 months is a potential outlier
Displaying Quantitative Data • Histograms • Quantitative variables often take many values. A graph of the distribution may be clearer if nearby values are grouped together. • The most common graph of the distribution of one quantitative variable is a histogram. How to Make a Histogram • Divide the range of data into classes of equal width. • Find the count (frequency) or percent (relative frequency) of individuals in each class. • Label and scale your axes and draw the histogram. The height of the bar equals its frequency. Adjacent bars should touch, unless a class contains no individuals.
Displaying Quantitative Data • Making a Histogram • The table on page 35 presents data on the percent of residents from each state who were born outside of the U.S. Number of States Percent of foreign-born residents
Displaying Quantitative Data • Using Histograms Wisely • Here are several cautions based on common mistakes students make when using histograms. Cautions • Don’t confuse histograms and bar graphs. • Don’t use counts (in a frequency table) or percents (in a relative frequency table) as data. • Use percents instead of counts on the vertical axis when comparing distributions with different numbers of observations. • Just because a graph looks nice, it’s not necessarily a meaningful display of data.
Using the class data and a graphing calculator, calculate the numerical summaries for the number of contacts. The numerical summaries include Mean, Standard Deviation, Sample Size, Minimum, First Quartile, Median, Third Quartile, Maximum, range, and Interquartile Range
Describing Quantitative Data • Measuring Center: The Median • Another common measure of center is the median. In section 1.2, we learned that the median describes the midpoint of a distribution. • Definition: • The median M is the midpoint of a distribution, the number such that half of the observations are smaller and the other half are larger. • To find the median of a distribution: • Arrange all observations from smallest to largest. • If the number of observations n is odd, the median M is the center observation in the ordered list. • If the number of observations n is even, the median M is the average of the two center observations in the ordered list.
Describing Quantitative Data • Measuring Spread: The Interquartile Range (IQR) • A measure of center alone can be misleading. • A useful numerical description of a distribution requires both a measure of center and a measure of spread. How to Calculate the Quartiles and the Interquartile Range • To calculate the quartiles: • Arrange the observations in increasing order and locate the median M. • The first quartile Q1is the median of the observations located to the left of the median in the ordered list. • The third quartile Q3is the median of the observations located to the right of the median in the ordered list. • The interquartile range (IQR) is defined as: • IQR = Q3 – Q1
Describing Quantitative Data • Find and Interpret the IQR Travel times to work for 20 randomly selected New Yorkers M = 22.5 Q3= 42.5 Q1= 15 IQR = Q3 – Q1 = 42.5 – 15 = 27.5 minutes Interpretation: The range of the middle half of travel times for the New Yorkers in the sample is 27.5 minutes.
Describing Quantitative Data • The Five-Number Summary • The minimum and maximum values alone tell us little about the distribution as a whole. Likewise, the median and quartiles tell us little about the tails of a distribution. • To get a quick summary of both center and spread, combine all five numbers. Definition: The five-number summary of a distribution consists of the smallest observation, the first quartile, the median, the third quartile, and the largest observation, written in order from smallest to largest. Minimum Q1 M Q3 Maximum
Describing Quantitative Data • Boxplots (Box-and-Whisker Plots) • The five-number summary divides the distribution roughly into quarters. This leads to a new way to display quantitative data, the boxplot. How to Make a Boxplot • Draw and label a number line that includes the range of the distribution. • Draw a central box from Q1to Q3. • Note the median M inside the box. • Extend lines (whiskers) from the box out to the minimum and maximum values that are not outliers.
Describing Quantitative Data • Identifying Outliers • In addition to serving as a measure of spread, the interquartile range (IQR) is used as part of a rule of thumb for identifying outliers. Definition: The 1.5 x IQR Rule for Outliers Call an observation an outlier if it falls more than 1.5 x IQR above the third quartile or below the first quartile. In the New York travel time data, we found Q1=15 minutes, Q3=42.5 minutes, and IQR=27.5 minutes. For these data, 1.5 x IQR = 1.5(27.5) = 41.25 Q1 - 1.5 x IQR = 15 – 41.25 = -26.25 Q3+ 1.5 x IQR = 42.5 + 41.25 = 83.75 Any travel time shorter than -26.25 minutes or longer than 83.75 minutes is considered an outlier. 0 5 1 005555 2 0005 3 00 4 005 5 6 005 7 8 5
Describing Quantitative Data • Construct a Boxplot • Consider our NY travel times data. Construct a boxplot. Max=85 Recall, this is an outlier by the 1.5 x IQR rule M = 22.5 Q1= 15 Min=5 Q3= 42.5
Describing Quantitative Data • Measuring Center: The Mean • The most common measure of center is the ordinary arithmetic average, or mean. Definition: To find the mean (pronounced “x-bar”) of a set of observations, add their values and divide by the number of observations. If the n observations are x1, x2, x3, …, xn, their mean is: In mathematics, the capital Greek letter Σis short for “add them all up.” Therefore, the formula for the mean can be written in more compact notation:
Describing Quantitative Data • Measuring Center • Use the data below to calculate the mean and median of the commuting times (in minutes) of 20 randomly selected New York workers. 0 5 1 005555 2 0005 3 00 4 005 5 6 005 7 8 5 Key: 4|5 represents a New York worker who reported a 45-minute travel time to work.
Describing Quantitative Data • Comparing the Mean and the Median • The mean and median measure center in different ways, and both are useful. • Don’t confuse the “average” value of a variable (the mean) with its “typical” value, which we might describe by the median. Comparing the Mean and the Median The mean and median of a roughly symmetric distribution are close together. If the distribution is exactly symmetric, the mean and median are exactly the same. In a skewed distribution, the mean is usually farther out in the long tail than is the median.
Describing Quantitative Data • Measuring Spread: The Standard Deviation • The most common measure of spread looks at how far each observation is from the mean. This measure is called the standard deviation. Let’s explore it! • Consider the following data on the number of pets owned by a group of 9 children. • Calculate the mean. • Calculate each deviation. • deviation = observation – mean deviation: 1 - 5 = -4 deviation: 8 - 5 = 3 = 5
Describing Quantitative Data • Measuring Spread: The Standard Deviation 3) Square each deviation. 4) Find the “average” squared deviation. Calculate the sum of the squared deviations divided by (n-1)…this is called the variance. 5) Calculate the square root of the variance…this is the standard deviation. “average” squared deviation = 52/(9-1) = 6.5 This is the variance. Standard deviation = square root of variance =
Describing Quantitative Data • Measuring Spread: The Standard Deviation Definition: The standard deviationsxmeasures the average distance of the observations from their mean. It is calculated by finding an average of the squared distances and then taking the square root. This average squared distance is called the variance.
Describing Quantitative Data • Choosing Measures of Center and Spread • We now have a choice between two descriptions for center and spread • Mean and Standard Deviation • Median and Interquartile Range Choosing Measures of Center and Spread • The median and IQR are usually better than the mean and standard deviation for describing a skewed distribution or a distribution with outliers. • Use mean and standard deviation only for reasonably symmetric distributions that don’t have outliers. • NOTE: Numerical summaries do not fully describe the shape of a distribution. ALWAYS PLOT YOUR DATA!
Data Analysis: Making Sense of Data Summary In this section, we learned that… • A dataset contains information on individuals. • For each individual, data give values for one or more variables. • Variables can be categorical or quantitative. • The distribution of a variable describes what values it takes and how often it takes them. • Inference is the process of making a conclusion about a population based on a sample set of data.
Data Analysis: Making Sense of Data Summary In this section, we learned that… • A dataset contains information on individuals. • For each individual, data give values for one or more variables. • Variables can be categorical or quantitative. • The distribution of a variable describes what values it takes and how often it takes them. • Inference is the process of making a conclusion about a population based on a sample set of data.
Analyzing Categorical Data Summary In this section, we learned that… • The distribution of a categorical variable lists the categories and gives the count or percent of individuals that fall into each category. • Pie charts and bar graphs display the distribution of a categorical variable. • A two-way table of counts organizes data about two categorical variables. • The row-totals and column-totals in a two-way table give the marginal distributions of the two individual variables. • There are two sets of conditional distributions for a two-way table.
Analyzing Categorical Data Summary, continued In this section, we learned that… • We can use a side-by-side bar graph or a segmented bar graph to display conditional distributions. • To describe the association between the row and column variables, compare an appropriate set of conditional distributions. • Even a strong association between two categorical variables can be influenced by other variables lurking in the background. • You can organize many problems using the four steps state, plan, do, and conclude.
Displaying Quantitative Data with Graphs Summary In this section, we learned that… • You can use a dotplot, stemplot, or histogram to show the distribution of a quantitative variable. • When examining any graph, look for an overall pattern and for notable departures from that pattern. Describe the shape, center, spread, and any outliers. Don’t forget your SOCS! • Some distributions have simple shapes, such as symmetric or skewed. The number of modes (major peaks)is another aspect of overall shape. • When comparing distributions, be sure to discuss shape, center, spread, and possible outliers. • Histograms are for quantitative data, bar graphs are for categorical data. Use relative frequency histograms when comparing data sets of different sizes.