Download
1 / 28
300 likes | 368 Views
Explore the potential intensity of tropical cyclones, with a focus on air-sea fluxes and turbulence in the boundary layer. Learn about Emanuel's theory, drag coefficients, and factors affecting maximum wind speed and enthalpy flux. Discover various explanations for capped drag coefficients in cyclones.

E N D
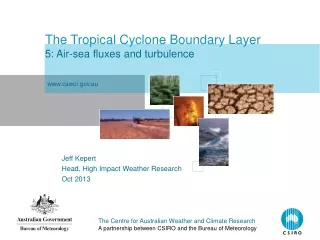
The Tropical Cyclone Boundary Layer5: Air-sea fluxes and turbulence www.cawcr.gov.au Jeff Kepert Head, High Impact Weather Research Oct 2013
Tropical Cyclone Potential Intensity • For a given environment, how intense can a tropical cyclone get? • Environment includes SST, temperature and moisture sounding • Important question, applications include • Forecasting • Structure design • Risk analysis • Theory • Climate change • Several theories, Emanuel is most widely accepted The Centre for Australian Weather and Climate ResearchA partnership between CSIRO and the Bureau of Meteorology
Emanuel’s Potential Intensity Theory • Assumes an axisymmetric TC, consisting of two components: • The boundary layer, and • the rest. • Above the boundary layer, • saturated moist ascent is assumed neutrally buoyant • surfaces of θe* and Ma coincide • flow is in gradient and hydrostatic balance • Within the boundary layer • Model as a linearised slab model with surface friction and enthalpy flux via bulk formulae (Ooyama 1969) • Later versions account for dissipative heating The Centre for Australian Weather and Climate ResearchA partnership between CSIRO and the Bureau of Meteorology
Emanuel’s Potential Intensity Theory • After much algebra … • Vm is maximum wind speed (intensity) • CD and Ck are exchange coefficients • Ts and To are the surface and outflow temperatures • θe and θe* are the equivalent potential temperature and saturated equivalent potential temperature in the boundary layer at the RMW • cp is the heat capacity of air The Centre for Australian Weather and Climate ResearchA partnership between CSIRO and the Bureau of Meteorology
Emanuel’s Potential Intensity Theory PI for Pacific Ocean in September Emanuel (1986, JAS) The Centre for Australian Weather and Climate ResearchA partnership between CSIRO and the Bureau of Meteorology
Emanuel’s Potential Intensity Theory • For realistic results, require Ck/CD to be close to 1 • Data at the time suggested that Ck/CD < 0.5 at high winds • Does the enthalpy flux increase at high winds? • Sea spray investigated, but shown to probably not be the explanation • Or is the drag coefficient “capped”? • Also (weak) evidence from storm surge models and budget calculations. CD ??? ~10-3 Ck 0 0 5 20 50 V10 (m/s) The Centre for Australian Weather and Climate ResearchA partnership between CSIRO and the Bureau of Meteorology
Powell et al (2003), profile method • In the surface layer, v(z) = u*/k log(z/z0) where • u* is the friction velocity • z0 is the roughness length • Bulk formula τ/ρ = u*2 = CD v102 The Centre for Australian Weather and Climate ResearchA partnership between CSIRO and the Bureau of Meteorology
Powell et al (2003), profile method • Fit curves to v(z) = u*/k log(z/z0) to calculate u* and z0 • Then get CD CD = (u*/v10)2 = (k/log(z/z0))2 • NB Normally a stability correction is needed, but not here since the wind shear is so strong The Centre for Australian Weather and Climate ResearchA partnership between CSIRO and the Bureau of Meteorology
Powell et al (2003), results • Stress “levels off” at high winds • CD and z0 decrease u* CD z0 The Centre for Australian Weather and Climate ResearchA partnership between CSIRO and the Bureau of Meteorology
Laboratory measurements • Wind-wave tunnel • Multiple methods for measuring stress • Clear evidence of cap • Airflow measurements showed flow separation to lee of waves • Donelan et al (2004, GRL) The Centre for Australian Weather and Climate ResearchA partnership between CSIRO and the Bureau of Meteorology
Fluxes: the CBLAST experiment • CBLAST: Coupled Boundary Layers Air Sea Transfer • Major field program to measure air-sea fluxes • Specially instrumented aircraft • Stepped descents between rainbands (not eyewall) • Black et al (2007 BAMS) The Centre for Australian Weather and Climate ResearchA partnership between CSIRO and the Bureau of Meteorology
CBLAST: Enthalpy flux • CE is approximately constant with wind speed • French et al. 2007 JAS, Drennan et al. 2007 JAS) The Centre for Australian Weather and Climate ResearchA partnership between CSIRO and the Bureau of Meteorology
CBLAST: stress Large and Pond • CBLAST CD measurements consistent with earlier measurements • Confirm “cap” • French et al. 2007 JAS, Drennan et al. 2007 JAS) Donelan et al Powell et al CBLAST The Centre for Australian Weather and Climate ResearchA partnership between CSIRO and the Bureau of Meteorology
Why is the drag coefficient capped? • Flow separation over waves (Donelan et al. 2004 GRL) • Other wave-based mechanisms (Bye and Jenkins 2006 JGR; Moon et al. 2004a,b JAS) • Sea spray stress (Andreas 2004 JAS) • Sea spray density effect on TKE equation (Makin 2005 BLM) • Many quite different explanations … which is correct??? The Centre for Australian Weather and Climate ResearchA partnership between CSIRO and the Bureau of Meteorology
V20 = 15 m/s Black et al 1988, W&F The Centre for Australian Weather and Climate ResearchA partnership between CSIRO and the Bureau of Meteorology
V20 = 27 m/s Black et al 1988, W&F The Centre for Australian Weather and Climate ResearchA partnership between CSIRO and the Bureau of Meteorology
V20 = 38 m/s Black et al 1988, W&F The Centre for Australian Weather and Climate ResearchA partnership between CSIRO and the Bureau of Meteorology
‘t V20 = 50 m/s Black et al 1988, W&F The Centre for Australian Weather and Climate ResearchA partnership between CSIRO and the Bureau of Meteorology
Gusts • Meteorologists would prefer to work with the mean wind, but gusts are important too • Damage is better correlated to gusts • Buildings respond to wind on short time scales • Some forecast agencies issue gust information • Need methods to estimate gusts given the mean wind • This research from WMO project to study cyclone intensity conversion for wind averaging period (Harper, Kepert and Ginger, 2010, WMO/TD-No.1555) The Centre for Australian Weather and Climate ResearchA partnership between CSIRO and the Bureau of Meteorology
Gusts • The mean wind is just the mean. • Different centres use different averaging periods, but on average, the sample mean should equal the true mean regardless of the averaging period. • The expected values of a randomly-sampled 10-min mean and a randomly-sampled 1-min mean are the same. • There is no need to “convert” wind observations • However, most in the TC community were used to converting TC intensity and applied this to wind observations also The Centre for Australian Weather and Climate ResearchA partnership between CSIRO and the Bureau of Meteorology
Defining a gust • Take a long sample of wind (e.g. 10 min, 1 hour), and choose the highest wind over some shorter averaging period (e.g. 3 sec). • That is called the gust. • The gust depends on • the reference period • the (short) averaging period 3-s gust 10 mins of 1-s wind data measured by a sonic anemometer. The circles show the 3-s mean, and the bars the 1-min mean The Centre for Australian Weather and Climate ResearchA partnership between CSIRO and the Bureau of Meteorology
Gust factors • In practice, gusts are often predicted using a gust factor • <max gust> = <mean wind> G3,600 • where is the gust factor. • 3 indicates the averaging period of 3 s • 600 is the reference period of 10 min The Centre for Australian Weather and Climate ResearchA partnership between CSIRO and the Bureau of Meteorology
Gusts and TC intensity • Many centres define cyclone intensity in terms of a gust • USA: the strongest 1-min mean wind occurring anywhere in the storm • Australia: the strongest 10-min mean wind occurring anywhere in the storm • “Strongest” implies that we are searching though a large collection of 1(10)-min mean winds, looking for the biggest one. • Hence this definition is a gust • The averaging period is 1(10) min • The search domain is the whole storm • So cyclone intensity will depend on the averaging period. • Because the 10-min mean will filter out more of the turbulence The Centre for Australian Weather and Climate ResearchA partnership between CSIRO and the Bureau of Meteorology
Gusts and cyclone intensity • Cyclone intensity will depend on the averaging period • Shorter period => less filtering of the turbulence => higher intensity • 1-min intensity > 10-min intensity • But measured winds, on average, will not The Centre for Australian Weather and Climate ResearchA partnership between CSIRO and the Bureau of Meteorology
How to convert cyclone intensity • Problem: • Given the maximum 1-minute mean wind in a cyclone V60, • Estimate the maximum 10-minute mean wind in the cyclone V600. • Both of these are gusts! • Adopted procedure: • The storm is large, so assume the gust reference period is long • In practice, use 1 hour • Back out the true mean wind, using a gust factor • Vmean = V60 / G60,3600 (V60 is the intensity from NHC) • Estimate the 10-min gust, using another gust factor • V600 = Vmean G600,3600 (V600 is the intensity from BoM, etc) • Adjustment factor is G600,3600 /G60,3600 The Centre for Australian Weather and Climate ResearchA partnership between CSIRO and the Bureau of Meteorology
Converting for wind averaging period … • The factor G600,3600 /G60,3600 can be estimated from gust theory • For neutral flow, it depends only on the surface roughness length • Historical factor of 0.88 derived from Simion and Scanlu with z0=20 mm • This is a smooth land value • Ocean z0 is much smaller, 1 – 3 mm. The Centre for Australian Weather and Climate ResearchA partnership between CSIRO and the Bureau of Meteorology
Converting for wind averaging period … • Factors from Harper et al (2003), now recommended for adoption by WMO • Different factors for different exposures • Significant change to “traditional” 0.88 for over-sea exposure • Partly updated gust theory • Mainly use of correct surface roughness • Implemented operationally by La Reunion, Australia, others? The Centre for Australian Weather and Climate ResearchA partnership between CSIRO and the Bureau of Meteorology
Summary • PI theory predicts that Ck/CD is ~1 • Older measurements suggest ~0.5 at high winds, but that is too low (according to the theory) • Profile method shows that CD is “capped” • Other methods generally agree • Major triumph for PI theory • TC intensity estimates are often “converted” for wind averaging period • E.g. through modification of the Dvorak intensity tables. • Widely-used theory assumed flow over land • Led to an excessive adjustment (0.88), quite different to at-sea value (0.93) • There is now an inhomogeneity in some best-track datasets The Centre for Australian Weather and Climate ResearchA partnership between CSIRO and the Bureau of Meteorology