
Exponential Function: Finding a and b from Given Points
E N D
Presentation Transcript
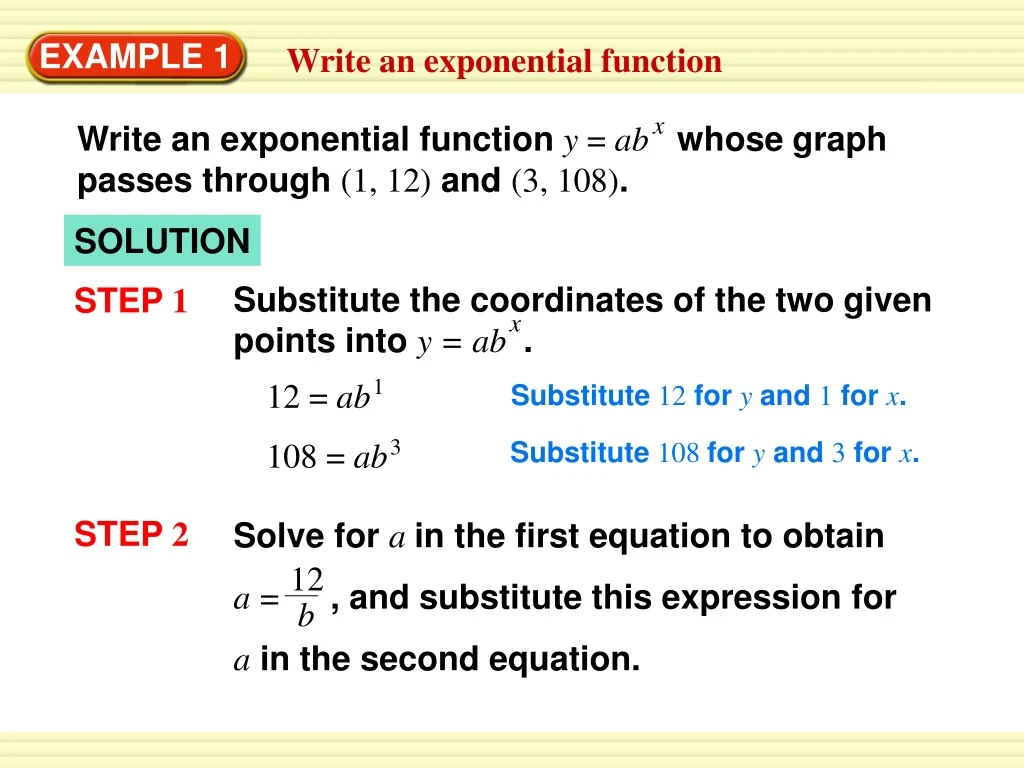
x Write an exponential function y = abwhose graph passes through (1, 12) and (3, 108). Substitute the coordinates of the two given points into y = ab . x 12 1 b 12 = ab 3 108 = ab Solve for a in the first equation to obtain a= , and substitute this expression for ain the second equation. EXAMPLE 1 Write an exponential function SOLUTION STEP 1 Substitute 12 for yand 1 for x. Substitute 108 for yand 3 for x. STEP 2
Substitute for ain second equation. 108 = b3 12 12 12 3 b b x Determine that a = = = 4.so, y = 4 3 . 108 = 12b 2 12 b 2 9 = b EXAMPLE 1 Write an exponential function Simplify. Divide each side by 12. 3 = b Take the positive square root because b > 0. STEP 3
Scooters A store sells motor scooters. The table shows the number yof scooters sold during the xth year that the store has been open. EXAMPLE 2 Find an exponential model • Draw a scatter plot of the data pairs (x, ln y). Is an exponential model a good fit for the original data pairs (x, y)? • Find an exponential model for the original data.
EXAMPLE 2 Find an exponential model SOLUTION STEP 1 Use a calculator to create a table of data pairs (x, ln y). STEP 2 Plot the new points as shown. The points lie close to a line, so an exponential model should be a good fit for the original data.
x Find an exponential model y = abby choosing two points on the line, such as (1, 2.48) and (7, 4.56). Use these points to write an equation of the line. Then solve for y. 0.35x+ 2.13 y = e x y = e(e ) 2.13 0.35 x y = 8.41(1.42) EXAMPLE 2 Find an exponential model STEP 3 ln y – 2.48 = 0.35(x – 1) Equation of line ln y = 0.35x + 2.13 Simplify. Exponentiate each side using base e. Use properties of exponents. Exponential model
Scooters Use a graphing calculator to find an exponential model for the data in Example 2. Predict the number of scooters sold in the eighth year. Enter the original data into a graphing calculator and perform an exponential regression. The model is y = 8.46(1.42) . x Substituting x = 8(for year 8) into the model gives y = 8.46(1.42)140 scooters sold. 8 EXAMPLE 3 Use exponential regression SOLUTION
x Write an exponential function y = abwhose graph passes through the given points. x y = 3 2 1 2 x 4 y = for Examples 1, 2 and 3 GUIDED PRACTICE 1. (1, 6), (3, 24) 3. (3, 8), (6, 64) x y = 2 SOLUTION SOLUTION 2. (2, 8), (3, 32) SOLUTION
4.WHAT IF?In Examples 2 and 3, how would the exponential models change if the scooter sales were as shown in the table below? for Examples 1, 2 and 3 GUIDED PRACTICE SOLUTION The initial amount would change to 11.39 and the growth rate to 1.45.


