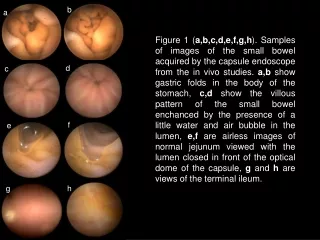
Download
1 / 29
350 likes | 684 Views
Learn how to analyze link budget, calculate EIRP, understand path loss models, and factor in propagation impairments for optimal wireless communication. Discover the importance of signal strength and receiver sensitivity in ensuring successful data transfer.

E N D
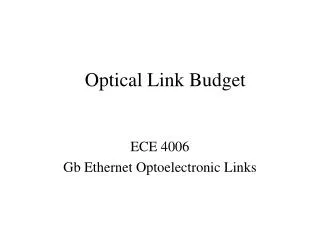
Gain Ant Ant Loss Feedline Feedline Gain Link Budget Analysis • A Link Budget analysis determines if there is enough power at the receiver to recover the information Transmitter Information Modulator Amplifier Filter RF Propagation Receiver Information Demodulator Pre-Amplifier Filter
Ant Feedline Transmit Power Components • Begin with the power output of the transmit amplifier • Subtract (in dB) losses due to passive components in the transmit chain after the amplifier • Filter loss • Feedline loss • Jumper loss • Etc. • Add antenna gain • dBi • Result is EIRP Transmitter Information Modulator Amplifier Filter RF Propagation
Component Value Scale Power Amplifier 25 Watts 44 dBm Filter loss (0.5) dB Jumper loss (1) dB Feedline loss 150 ft. at 1dB/100 foot (1.5) dB Antenna gain 12 dBi Total 53 dBm Calculating EIRP All values are example values
Path Loss Model • Path loss is a reduction in the signal’s power, which is a direct result of the distance between the transmitter and the receiver in the communication path. • There are many models used in the industry today to estimate the path loss and the most common are: • Free Space • Hata • Lee • Each model has its own requirements that need to be met in order to be utilized correctly. • The free space path loss is the reference point for the rest of the models used.
Free Space • Used as the foundation for all propagation models. • Typically underestimates the path loss actually experienced for mobile communications. • Used extensively for predicting Point-to-Point, fixed, path loss. • It uses the following formula to calculate the loss experienced by a signal: Free space path loss (dB): f in Hz, d in meters
Hata Model • Hata Model is used extensively in cellular communications. • Empirical Model based on Okumura’s data from Tokyo • Better estimates the path loss experienced as compared to Free Space. • Basic model is for urban areas, with extensions for suburbs and rural areas • Valid only for these ranges • Distance 1-20km • Base height 30-200m • Mobile height 1-10m • 150 MHz to 1500 MHz (note: some mobile bands are at 1900 MHz, so be careful)
Hata Model • Hata formula for urban areas: • LH = 69.55 + 26.16log10fc – 13.82log10hb – a(hm) + (44.9 – 6.55log10hb)log10R • hb is the base station antenna height in meters. • hm is the mobile antenna height also measured in meters. • R is the distance from the cell site to the mobile in km. • fc is the transmit frequency in MHz. • a(hm) is an adjustment factor for the type of environment and the hight of the mobile. • a(hm) = 0 for urban environments with a mobile height of 1.5m. • See textbook p. 88 for suburban and rural extensions
Propagation Impairments • Impairments result in signal loss that are added to the path loss. • Causes of impairments: • Morphology (general environment) • Obstructions (man made and natural) • Some propagation models incorporate Morphology impairments.
Morphology • Morphology describes the general type of environment the signal will propagate through. • Major Classifications of Morphology: • Dense Urban • Urban • Suburban • Rural
Man-Made Obstructions Man-made obstructions result in blockages, diffraction and reflection
Radio tower Natural Obstructions • Numerous types of natural obstructions: • Mountains • Water • Ravines • Earth curvature Obstructions result in bothblockages and diffraction
Diffraction • Results in bending of the wave. • Can occur in different situations when waves: • Pass through a narrow slit. • Pass the edge of a reflector. • Reflect off two different surfaces approximately one wavelength apart. • K-factor used in LOS calculations is a beneficial effect of diffraction of radio waves.
Received Signal Strength • The purpose of transmission is to create a strong enough signal at the receiver • RSS – Received Signal Strength (usually in dBm) • RSS determined by: • + Transmit power • - Filter and feedline loss • + Transmit antenna gain • - Path loss (various models) • RSS can be measured as well
Ant Receiver Information Demodulator Pre-Amplifier Filter Feedline Receiver System Components • The Receiver has several gains/losses • Specific losses due to known environment around the receiver • Vehicle/building penetration loss • Receiver antenna gain • Feedline loss • Filter loss • These gains/losses are added to the received signal strength • The result must be greater than the receiver’s sensitivity
Receiver Sensitivity • Sensitivity describes the weakest signal power level that the receiver is able to detect and decode • Sensitivity is determined by the lowest signal-to-noise ratio at which the signal can be recovered • Different modulation and coding schemes have different minimum SNRs • Range: <0 dB to 60 dB • Sensitivity is determined by adding the required SNR to the noise present at the receiver • Noise Sources • Thermal noise • Noise introduced by the receiver’s pre-amplifier
Receiver Noise Sources • Thermal noise • N = kTB (Watts) • k=1.3803 x 10⁻²³ J/K • T = temperature in Kelvin • B=receiver bandwidth • N (dBm) = 10log10(kTB) + 30 • Thermal noise is usually very small for reasonable bandwidths • Noise introduced by the receiver pre-amplifier • Noise Factor = SNRin/SNRout (positive because amplifiers always generate noise) • May be expressed linearly or in dB
Receiver Sensitivity Calculation • The smaller the sensitivity, the better the receiver • Sensitivity (W) = kTB * NF(linear) * minimum SNR required (linear) • Sensitivity (dBm) =10log10(kTB*1000) + NF(dB) + minimum SNR required (dB)10log10(kTB) + 30 + NF(dB) + minimum SNR required (dB)
Sensitivity Example • Example parameters • Signal with 200KHz bandwidth at 290K • NF for amplifier is 1.2dB or 1.318 (linear) • Modulation scheme requires SNR of 15dB or 31.62 (linear) • Sensitivity = Thermal Noise + NF + Required SNR • Thermal Noise = kTB = (1.3803 x 10⁻²³ J/K) (290K)(200KHz) = 8.006 x 10⁻¹⁶ W = -151dBW or -121dBm • Sensitivity (W) = (8.006 x 10⁻¹⁶ W )(1.318)(31.62) = 3.33 x 10⁻¹⁴ W • Sensitivity (dBm) = -121dBm + 1.2dB + 15dB = -104.8dBm • Sensitivity decreases when: • Bandwidth increases • Temperature increases • Amplifier introduces more noise
RSS and Receiver Sensitivity • Transmit/propagate chain produces a received signal has some RSS (Received Signal Strength) • EIRP - path loss • For example : 50dBm EIRP – 130 dBm = -80dBm • Receiver chain adds/subtracts to this • For example, +5dBi antenna gain, 3dB feedline/filter loss -78dBm signal into LNA of receiver • This must be greater than the sensitivity of the receiver • If the receiver has sensitivity of -78dBm or lower, the signal is successfully received.
Link Budgeting • By modeling the full transmit/receive system we know: • Given a transmit power and mobile distance, what the power of the signal going into the receiver’s LNA will be (RSS+receiver gains/losses) • How much power is required at the receiver’s LNA (Sensitivity) • Link budgeting for a cellular system is the process of achieving balance of these • At the boundaries of the cell, received power should equal receiver sensitivity • Usually, a fading margin is added
When we care about link budgets • For simple systems, we don’t care • Transmit at maximum legal power • No coverage Receiver moves • For cell-based systems, we have to: • Provide continuous coverage over the entire region • Ensure transmitters in one cell don’t interfere with those in the closest cell that uses the same frequency • Consider reducing cell size in order to have more capacity through a larger number of cells
What we can change • To achieve a balanced link budget within a given cell size we can: • Adjust transmit power • Adjust transmit tower height • Adjust transmit antenna gain • Modify the receivers • For planning a system we can use a link budget to: • Determine the cell size • Determine the frequency reuse ratio
Forward and Reverse Paths • For two-way radio systems, there are two link budgets • Base to mobile (Forward) • Mobile to base (Reverse) • The system link budget is limited by the smaller of these two (usually reverse) • Otherwise, mobiles on the margin would have only one-way capability • The power of the more powerful direction (usually forward) is reduced so there is no surplus • Saves power and reduces interference with neighbors
Forward (Base to Mobile) Amplifier power 45dBm Filter loss (2dB) Feedline loss (3dB) TX Antenna gain 10dBi Path loss X Fade Margin (5dB) Vehicle Penetration (12dB) RX Antenna gain 3dBi Feedline loss (3dB) Signal into mobile’s LNA has strength 33dBm – path loss If Mobile Sensitivity is -100dBm Maximum Path loss = 133dB Forward/Reverse Link Budget Example • Reverse (Mobile to Base) • Amplifier power 28dBm • Filter loss (1dB) • Feedline loss (3dB) • TX Antenna gain 3dBi • Fade Margin (5dB) • Vehicle Penetration (12dB) • Path Loss X • RX Antenna gain 10dBi • Feedline loss (3dB) • Signal into base’s LNA has strength 17dBm – path loss • If Base Sensitivity is -105dBm • Maximum Path loss = 122dB Unbalanced – Forward path can tolerate 11dB more loss (distance) than reverse