Download
1 / 55
600 likes | 1.04k Views
CAPA- Choice and Partnership Approach: summary of research and evaluation to 2010. Ann York and Steve Kingsbury Rowe.york@btinternet.com Steve.Kingsbury@hertspartsft.nhs.uk www.camhsnetwork.co.uk. How many studies?. National (3) 1 UK 2007 1 England 2009 1 New Zealand 2010 Local (16)

E N D
CAPA- Choice and Partnership Approach:summary of research and evaluation to 2010 Ann York and Steve Kingsbury Rowe.york@btinternet.com Steve.Kingsbury@hertspartsft.nhs.uk www.camhsnetwork.co.uk
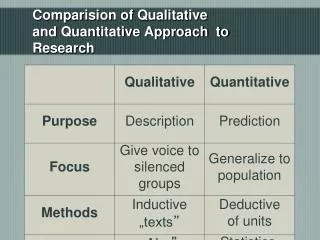
How many studies? National (3) 1 UK 2007 1 England 2009 1 New Zealand 2010 Local (16) CAMHS 2 NZ 1 Australia 13 UK Adult (1) 1 NZ Published data: all UK CAMHS 1 national (England) 2 UK New Ways of Working studies 1 redesign report (Richmond) 7 local and 1 national: CAPA book and website Type of Data Quantitative e.g waits: 15 User views: 10 Staff views: 12 Referrer views: 3
National evaluation: England 2009, Mental Health Foundation 97 teams implementing Av 6 out of 11 Key Components, range 1- 10.5 waits to a first appointment dropped from 7-108 weeks before to 5-12 weeks after CAPA (N=7) Families satisfied Reduced demands on the service More formalised team working and better planning infrastructure Greater transparency for staff and families Few teams were implementing Job plans (Key component 8) Full booking systems (K c 5) Handling demand ( K c 3) Recommendations: including CAPA should be rolled out gradually, for teams to opt-in A national support framework for CAPA should be established
National Survey , 2007 Steve Kinsgbury & Ann York Online survey 40 teams out of 113 were using CAPA On average CAPA in place 8 months Waits: CAPA teams Before CAPA: average 20 weeks After CAPA: 73% had waits to Choice of 6 weeks or less Non- CAPA teams Wait to first appointment on average 12 weeks. Only 33% had waits of 6 weeks or less CAPA compliance on items 2-11: CAPA teams 7.1 Non-CAPA: 2.5
National evaluation NZ 2010 Awaiting data analysis Oct 2010! Evaluation data collection complete.
Local studies (16 CAMHS & 1 GAMHS) International: CAMHS 2 NZ - Capital Coast; Christchurch 1 Australia- Kirwan Adult 1 NZ GAMHS- Wellington UK (13 CAMHS): Sheffield Somerset Lincs Bristol Exeter Gloucs Stockton (NWW) Stockport Glasgow East Herts (staff) E Herts (users) Richmond (NWW) Richmond (service)
User views 2 NZ 8 UK Mix of direct interviews and questionnaires Overwhelming majority extremely positive: Seen quickly Felt listened to Got new ideas
Staff views Data 1 NZ 9 UK Results Increased job satisfaction Increased morale Anxiety about change Improved team working More focussed Love team discussion Increased learning
Quantitative impacts Data: 1 NZ 8 UK Waits Pre CAPA: range from 5- 9 months Post CAPA: range from 1-6 weeks Transfer to Partnership range 66- 90% Waits to Partnership 4 weeks (some teams developed longer waits due to not implementing full booking) DNAs: 5- 10 %
Adult Mental Health Data 1 NZ (4 GAMHS) Waits Pre CAPA: 35 days Post CAPA: 20 days DNAs Pre CAPA: 3% Post CAPA: 2.8% Activity 12% increase in referrals 11% increase number offered appt 11% increase in patients seen
NATIONAL CAPA Implementation in England Mental Health Foundation 2009 www.chimat.org.uk/resource/item.aspx?RID=82450
Phase 1 Phase 1 was a national survey of CAMHS in England • 123 staff from 442 teams answered a questionnaire • 97 teams stated they were implementing CAPA • 53 of these 97 teams completed a more detailed survey: • on average, were implementing 6 out of the 11 CAPA key components (range 1 to 10.5). • 7 teams supplied audit data pre and post CAPA implementation: • waits to a first appointment dropped from 7-108 weeks before implementation to 5-12 weeks after
Phase 2 Phase 2 involved visits to six CAPA teams Benefits reported were: • Reduced waiting times • 92% of families were seen within 13 weeks compared with the national average of 78%. • Families were pleasantly surprised at how quick they could get into the service • Reduced demands on the service • More formalised team working and better planning infrastructure • Greater transparency for staff and families
Challenges • Few teams were implementing • Job plans (Key component 8) • Full booking systems (K c 5) • Handling demand ( K c 3) Result was waits to Partnership. Teams felt the need for more information and support in how to apply CAPA to complex and long term cases.
National recommendations • 1.CAPA should be rolled out gradually, for teams to opt-in • 2.A national support framework for CAPA should be established • 3.An enhanced training package should be available • 4.A national online network and directory of CAPA implementers could be developed • 5.The CAPA implementation training and support package needs to address the commonly held CAPA Myths • 6.Case studies to illustrate how the system can work in different types of services
Local Implementer recommendations • 1.Facilitative team management is crucial- an informed manager, a clinical lead, and an administrative lead (CAPA Key Component 1) • 2.CAMHS teams implementing CAPA need mechanisms to facilitate effective team working: peer group supervision and regular away days (CAPA Key Components 10 and 11) • 3.Children’s Trust directories should be used to promote multi-agency work or to signpost families • 4.Successful implementation of CAPA should involve staff from a variety of roles within the CAMHS • 5.Monitoring and feedback are integral prior to, during, and after the implementation phase • 6.Local regional support systems should appoint a number of local CAPA champions
Survey of CAPA implementation 2007 Kingsbury & York, 2007 www.camhsnetwork.co.uk/Evaluation/evaluation-web-survey-2007.htm
Method November 2007 • we contacted services known to us and put a request out on an international discussion forum (FOCUS Mailbase; focus@cru.rcpsych.ac.uk) through an online questionnaire • We asked for general information about their services, whether or not they had implemented CAPA and the impact • We asked for ratings on items 2 to 11 of the 11 Key Components of CAPA i.e. omitted Item 1: Management and Leadership (we hadn’t highlighted this item then)
Results • 40 out of 113 people had implemented CAPA • On average, CAPA had been in place for 8 months • Teams received on average 47 referrals per FTE per year: 50% were in the range 57 to 33 FTE Waits: CAPA teams • Before CAPA: average 20 weeks • After CAPA: 73% had waits to Choice of 6 weeks or less Non- CAPA teams • Wait to first appointment on average 12 weeks. Only 33% had waits of 6 weeks or less
NZ National Evaluation 2010 Werry Centre
Local Implementation References available from Ann
Green Team, Canterbury DHB NZ Karina Falconer-Beach 2008 National innovation Award report: TRIALLING THE CHOICE AND PARTNERSHIP APPROACH: RIGHT TIME, RIGHT INTERVENTION WITH THE RIGHT PEOPLE Method: Dec 2007 to April 2008 Compared CAPA in Green Team to 2 pre CAPA cohorts in previous 2 yrs 8 month development phase Skills mapping 2007/08 CAPA gp: 51 families (52 children) 5-12 yrs 2006/07 Pre CAPA gp 1: 33 families 5-12 yrs 2005/06 Per CAPA gp 2; 33 families 2-12 yrs
Green Team (2) Quantitative • 750 refs pa, accept 450 • 5.5.FTE Waits: • Pre CAPA: 6-9 mths • 12 mth internal waits. Post CAPA: • Lower first appt DNA rate in CAPA gp • Transfer to Part: 90% with 13.4% DNA • Time to discharge: • At 6 mths over 50% CAPA gp closed cf 32% gp 1 and 23% gp 2 • Co-work rate CAPA: 84%
Green Team (3) User experience Goals set: • CAPA gp: 82% • Gp 1 and 2: 0 Family friendly letters: • CAPA: 98% • Gp 1 and 2; 0% or no letter at all Satisfaction: Choice Que: • High satisfaction • Independent Phone call: • 9/10 happy • No formal complaints (usually 2-3) • CAPA: reduction in CBCL scores post treatment
Green Team (4) staff experiences Choice done by experienced staff • Work satisfaction Que: • CAPA staff reported more satisfied, felt more valued and enjoyed work more than non CAPA staff • Attitude to families shifted to more collaborative • Easier to ‘let go’ of families with CAPA • Felt like a burden been lifted.
Green Team (5) other CAPA-CRS: 86% full implementation GPs and referers: post discharge- positive
Lincolnshire Stephanie Stockbridge, Anne Thompson, 2007 • 7 mths preparation • Started Feb 2007 • 15 FTE • 20 refs pw • Waiting list of 77- blitz • Daily ref screening Results • Waits: Pre CAPA: 25 wks Post: 6 wks • Trans to Partnership rate: 80% • Co-therapy rate: 57% • 100% staff satisfied with offering Choice • CAPA-CRS: 66 % compliance at 6 months
Bridgeton, Glasgow Wendy Jenkin, 2006 Implementation in Under 12s service • SDQ • CHI ESQ • Clinician Que Results Waits Pre CAPA: 9 mths Post: a few weeks DNA 6% User feedback: N=28 (response rate 34%) Majority very satisfied
Bridgeton (2) Staff views: • N=7: • Initial anxiety • Use clearer language • Focussed • Sense of partnership with families • Clarity • More relaxed • More systematic • Less stress in team GP/referrer feedback: • N=52 • Good service • Feedback reports rather long but clear
Sheffield Nevyne Chaloub, 2009 CAPA 1 year on data: 3 teams Quantitative data plus staff views 6 months in. 25 matched pairs pre and post CAPA % Redirected at referral reduced from around 25% to 8-16% Increase in referrals from around 400 (accepted 350 to 400 to460) Waits: • Pre: • Post: 7-9 wks Choice to Partnership wait: • 6-8 wks C/P trans rate: 72-62% DNA: 9-12% New: FU ratio 5.31- 8.4 Choice Plus: 2%
Clincians views One team less positive than the other 2. Felt imposed by management, rigid and hindered creativity • Did NOT think: • Added quality (less joint assessment) • Workload could be sustained • Mixed views on whether • Was efficient • My job plan is working • Agreed • Opportunities for discussion Compared to pre CAPA: • More shared understanding • 1 team-Increased job satisfaction and morale (tho some felt worse); other 2 mixed
2009 Positives: Prefer CAPA to old system Clincians now ask them to do more Felt well prepared for CAPA Tracking clients easier Easier to do Partnership admin More efficient than old system Higher workload Mixed views: re Choice admin 2010- all above areas more highly positive Negatives: Duplication in processes Ideas to improve Reduce time spent chasing clincians for slots Merge systems Admin staff
User experience References available from Ann
Youth views on CAPA Bridget Greaney, Capital & Coast, NZ 2009 • Youth views on CAPA- focus gp after presentation on CAPA • Views of Youth Consumers Advisors • User views Results: Youth Focus gp • Like: • Talk re goals not just problems • Match clinician to their needs • Don’t have to see Choice clinician again if not like them • The name ‘Choice’ • Dislike: • Choice if really sick, may say no • Word ‘Partnership’ not mean anything
Youth views (2) Advisor gp: • Reduced waits • Choice of appts • Clear pathway for users User views: • 12-19 yrs • N= 53 • 66% found Choice useful • 83% given enough info • 100% felt taken seriously
Audit of 100 families. Steve Kingsbury 2006 Tracking of the first 100 CAPA families in East Herts CAMHS: CHI-ESQ CAPA Experience Que Results Highly positive on all measures http://www.camhsnetwork.co.uk/Evaluation/evaluation-east-herts-user-capa.htm
User and Carer involvement in Service redesign: New Ways of Working national pilot. Ann York 2007 Que and direct interviews with children, young people and families • CHI ESQ: • Children n=7 • Young people n=27 • Parents/carers n= 35 Direct interviews: • Children < 11 y n= 3 • Young people 11-18 n = 11 • Parents/carers n= 34
Exeter: Vikki Barnes, 2009 Ques to Parents who had recently attended a Choice appt. • Response rate: 42% • CAPA Experience Que • CHI-ESQ Waits: • Pre CAPA: 6 mths • Post: 2-4 wks User views: • Choice appt was useful • CHI ESQ positive
User & Carer involvement (2) • Children, young people and parents/cares all very positive at interview and on CHI ESQ • Que feedback from GPs- positive Full report is 200 pages long http://www.newwaysofworking.org.uk/component/option,com_docman/task,doc_view/gid,247/org.uk/component/option,com_docman/task,doc_view/gid,247/
9 mths planning Started July 2006 6 FTE 338 referrals, accepted 267 (5 pw) WL Blitz: 39 families, took 1 mth Gloucester CAMHS Anna Burhouse, 2006
Gloucs (2) Results CAPA-CRS: 97% Waits: • Post: 3-4 wks • 4 wks to Partnership User feedback: • 100% positive Staff feedback: • Very positive • Higher job satisfaction
Richmond CAMHS Mona Botros & Ann York 2009 Method • Sept 2008 to Feb 2009: user feedback questionnaires on Choice • 1-5 Likert scale Results N= 43 Response rate 25% • 93% found Choice helpful or extremely helpful • 100% felt listened to • 53% got new ideas • 88% given enough info • 23% felt seen too quickly • 44% felt seen very quickly • 5 % felt waited too long • Free comments: 8 positive, 1 negative (parent demanding meds that were refused)
Richmond CAMHS (2) Hannah ThorpeVanishri Yadav, 2010 Method: March 2009- Feb 2010 Choice feedback forms completed by users Results: N=132 On Likert scale 1 to 5, scores of 4 and 5: 84% found the Choice appointment helpful/extremely helpful; 96% felt listened to 57% felt got new ideas 86% got enough info on the service 14% felt seen too quickly 39% felt wait was fine (waits were 4 weeks). Rest scored 3,2 or 1 (45% in total, mainly scores of 3)
Staff experience References available from Ann
Staff views on implementation Kingsbury & York2006 Method • Focus group of clincians, transcribed by assistant psychologist and analysed by Steve and Ann Results Before started: worry re • May not work • Adapting to new way of working What helped: • Vision • Leadership • Commitment • Planning What think like for families? • Focus on what they want • Easier to ensure CAMHS right service
Staff views (2) How change practice? • More focussed • Think more clearly • More collaborative • Shared language Problems: • Sense of missing something if not done Choice What helped transfer? • Clear formulation • Right skills • Iterative process • Flexibility re co-working
Staff views (3) Liked: • Pride in no waiting list • Referrers pleased How to make it work well: • Monitoring processes • Formulation with family • Team discussion • Trust in team Other tips • Get resource file • Adapt it
Staff views Caroline Fell Southmead CAMHS, Bristol, 2009 Method • 3month collection period • Que to all Choice clinicians • n= 17 Results • Majority of users waited 1 to 4 weeks for Partnership Majority of staff felt: • Intervention been discussed at Choice • Matching of skills/personality