Download
1 / 32
320 likes | 460 Views
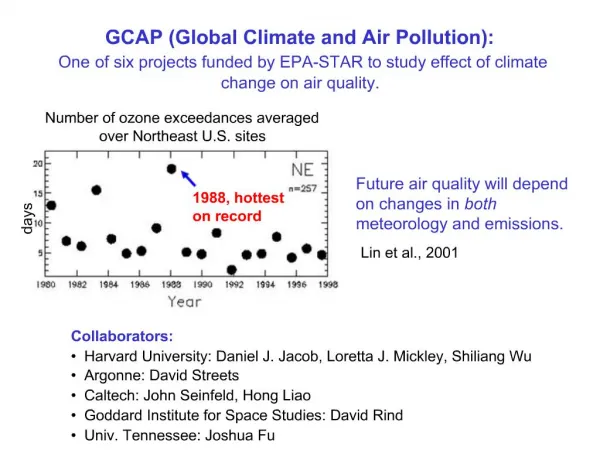
2007 Group Meeting Global Climate and Air Pollution (GCAP). at Harvard University Nicky Lam and Joshua Fu University of Tennessee October 12, 2007. GCAP Update UT Team. Find best MM5 schemes for GISS data Sensitivity analysis Best scenario for whole domain

E N D
2007 Group Meeting Global Climate and Air Pollution (GCAP) at Harvard University Nicky Lam and Joshua Fu University of Tennessee October 12, 2007
GCAP UpdateUT Team • Find best MM5 schemes for GISS data • Sensitivity analysis • Best scenario for whole domain • Best scenario for Northeastern States, Southeastern States, Central States, & West States • Preliminary run using Barry Lynn suggested base on the Best MM5 schemes in Northeastern States and other schemes combinations • CMAQ runs for 2001 and 2050
GISS/MM5 Downscale Modeling Highlighted scenario are the preliminary runs
Case 24 (Kain-Fritsch 2, Eta, Reisner 2, RRTM) has closer temperature compared to others • Similar wind speed were found on all cases • Similar wind direction were found on all cases
Noted: Noah LSM is not available due to lack of soil layers May need to discuss with Loretta to reprocessing the output from GEOS-Chem
MM5 Scheme Evaluation • Case 24 is used in all preliminary simulation. • This setting was suggested by Barry Lynn claimed to be the best scenario for Northeastern States
MM5 Setting • LAMBERT CONFORMAL • NO COARSE DOMAIN EXPANSION • TRUE LATITUDE 1 (degree) => 33 degrees • TRUE LATITUDE 2 (degree) => 45 degrees • Time increment between analysis times (s)=> 3 hrs data • Top pressure used in analysis, model lid (Pa) => 10000.00 • No FDDA • Number of half-sigma layers => 34 layers • Simulation duration for each run => 6 days with 12 hrs spinoff • Simulation time step => 90 seconds
MM5 Sigma Level => from INTERPF Noted: MCIP extracts the highlighted sigma level for CMAQ
Current Case Study • 2001 meteorology with 2001 emission • 2050 meteorology with 2001 emission • Find the effect that contributed from the change of GISS meteorology • Time period: June 1 to October 1 (Ozone season)
CMAQ • 14 layers (from the previous sigma levels) • ICON and BCON from GEOS-Chem from 3 hrs to one hour average • GISS meteorological Inputs • Input emission is compatible with 2001 EPA emission
MM5 Comparison between GISS_2001, GISS_2050 and NCEP_2001(FDDA)
CMAQ comparison 2001 GISS data 2050 GISS data
O3 concentration vs. Temperature Relationship
Maximum O3 At the same location
Avg NOx & Avg VOCs NOx limited Area, no big diff. More VOCs, but less O3, Main effect => T
PM2.5 & DCV 7.2 m 7.2 m 391 m 391 m
Visual Range Parameters: Deciview (dv) : dV = 10 ln (b / 0.01), b [km-1] : extinction coeff. Koschmieder Visual Range : Vr = 3.91 / b [km] dV Vr [km] b [km-1] 60 1.0 4.0 40 7.2 0.55 20 53 0.07 10 144 0.03 0 391 0.01
SO2 & Total Sulfur Dep. very minimal Effect
Comparison between 2050 and 2001 (2050 – 2001) Average Temp. & Average O3 Conc.
Comparison between 2050 and 2001 (2050 – 2001) Max Temp. & Max O3 Conc.