Download
1 / 8
90 likes | 940 Views
The Kruskal-Wallis H Test. The Kruskal-Wallis H Test is a nonparametric procedure that can be used to compare more than two populations in a completely randomized design. All n = n 1 +n 2 +…+n k measurements are jointly ranked (i.e.treat as one large sample).

E N D
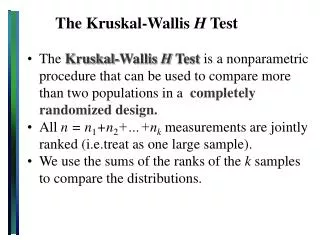
The Kruskal-Wallis H Test • The Kruskal-Wallis H Test is a nonparametric procedure that can be used to compare more than two populations in a completely randomized design. • All n = n1+n2+…+nkmeasurements are jointly ranked (i.e.treat as one large sample). • We use the sums of the ranks of the k samples to compare the distributions.
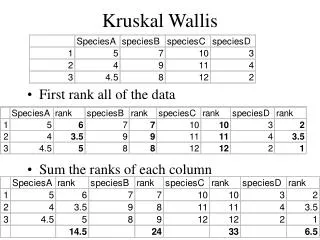
The Kruskal-Wallis H Test • Rank the total measurements in all k samples from 1 to n. Tied observations are assigned average of the ranks they would have gotten if not tied. • Calculate • Ti = rank sum for the ith sample i = 1, 2,…,k • And the test statistic
The Kruskal-Wallis H Test H0: the k distributions are identical versus Ha: at least one distribution is different Test statistic: Kruskal-Wallis H When H0 is true,the test statistic H has an approximate chi-square distribution with df = k-1. Use a right-tailed rejection region or p-value based on the Chi-square distribution.
1 2 3 4 65 75 59 94 87 69 78 89 73 83 67 80 79 81 62 88 Example Four groups of students were randomly assigned to be taught with four different techniques, and their achievement test scores were recorded. Are the distributions of test scores the same, or do they differ in location?
1 2 3 4 (3) 65 (7) 75 59 (1) (16) 94 87 (13) (5) 69 78 (8) 89 (15) (6) 73 83 (12) 67 (4) (10) 80 (9) 79 81 (11) 62 (2) (14) 88 Ti 31 35 15 55 Teaching Methods Rank the 16 measurements from 1 to 16, and calculate the four rank sums. H0: the distributions of scores are the same Ha: the distributions differ in location
Teaching Methods H0: the distributions of scores are the same Ha: the distributions differ in location Reject H0. There is sufficient evidence to indicate that there is a difference in test scores for the four teaching techniques. Rejection region: For a right-tailed chi-square test with a = .05 and df = 4-1 =3, reject H0 if H 7.81.
Key Concepts I. Nonparametric Methods These methods can be used when the data cannot be measured on a quantitative scale, or when • The numerical scale of measurement is arbitrarily set by the researcher, or when • The parametric assumptions such as normality or constant variance are seriously violated.
Key Concepts Kruskal-Wallis H Test: Completely Randomized Design 1. Jointly rank all the observations in the k samples (treat as one large sample of size n say). Calculate the rank sums, Ti= rank sum of sample i, and the test statistic 2. If the null hypothesis of equality of distributions is false, H will be unusually large, resulting in a one-tailed test. 3. For sample sizes of five or greater, the rejection region for H is based on the chi-square distribution with (k- 1) degrees of freedom.