Subcortical Encoding and Its Impact on Speech Perception in Noisy Environments
10 likes | 119 Views
This research poster explores the role of subcortical encoding in speech perception amidst different types of noise, focusing on amplitude-modulated vs. steady-state noise. We investigate how fluctuations in noise affect the 'dip listening' ability, wherein listeners can discern speech during brief pauses of background noise. Findings indicate that subcortical mechanisms, measured via frequency following responses (FFR), show varied engagement in noisy contexts. Additionally, while auditory processing is crucial, cognitive factors also play a significant role in speech perception.

Subcortical Encoding and Its Impact on Speech Perception in Noisy Environments
E N D
Presentation Transcript
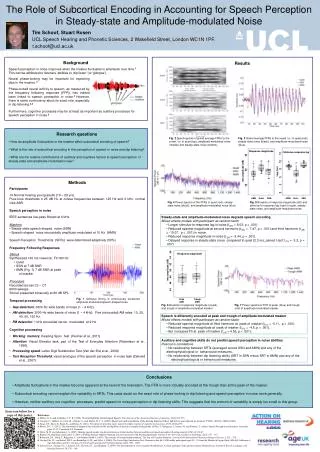
The Role of Subcortical Encoding in Accounting for Speech Perception in Steady-state and Amplitude-modulated Noise Poster Number Where appropriate My poster title Name Tim Schoof, Stuart Rosen Department UCL Speech Hearing and Phonetic Sciences, 2 Wakefield Street, London WC1N 1PF. t.schoof@ucl.ac.uk Background Results Speech perception in noise improves when the masker fluctuates in amplitude over time.1This can be attributed to listeners’ abilities to ‘dip listen’ (or ‘glimpse’). Neural phase-locking may be important for exploiting dips in the masker. 2 Phase-locked neural activity to speech, as measured by the frequency following response (FFR), has indeed been linked to speech perception in noise.3 However, there is some controversy about its exact role, especially in dip listening.2,4 Furthermore, cognitive processes may be at least as important as auditory processes for speech perception in noise.5 • Research questions • How do amplitude fluctuations in the masker affect subcortical encoding of speech? • What is the role of subcortical encoding in the perception of speech in noise and dip listening? • What are the relative contributions of auditory and cognitive factors to speech perception in steady-state and amplitude-modulated noise? Fig. 2 Spectrograms of grand average FFRs to the vowel / ɑ / in quiet (top), amplitude-modulated noise (middle) and steady-state noise (bottom). Fig. 3 Grand average FFRs to the vowel / ɑ / in quiet (red), steady-state noise (black), and amplitude-modulated noise (blue). Lag (ms) 2 4 6 8 10 12 Stimulus-response lag Response magnitude rms amplitude (dB) 45 50 55 • Methods • Participants • 19 Normal hearing young adults (19 – 29 yrs). • Pure-tone thresholds ≤ 25 dB HL at octave frequencies between 125 Hz and 6 kHz, normal click ABR. • Speech perception in noise • IEEE sentences low-pass filtered at 6 kHz. • Maskers • Steady state speech-shaped noise (SSN) • Speech-shaped noise sinusoidally amplitude-modulated at 10 Hz (AMN) • Speech Reception Thresholds (SRTs) were determined adaptively (50%) • Frequency Following Responses • Stimuli • Synthesized 100 ms vowel /ɑ/, F0:160 Hz • Quiet • SSN at 7 dB SNR • AMN (Fig. 1) 7 dB SNR at peak • of masker • Procedure • Recorded across Cz – C7 • 6000 sweeps • Stimuli presented binaurally at 80 dB SPL • Temporal processing • Gap detection: 3000-Hz wide bands of noise (1 – 4 kHz). • AM detection: 3000-Hz wide bands of noise (1 – 4 kHz). Five (sinusoidal) AM rates: 10, 20, 40, 80, 160 Hz. • FM detection: 1 kHz sinusoidal carrier modulated at 2 Hz. • Cognitive processing • Working memory: Reading Span Test (Rudner et al., 2011) • Attention: Visual Elevator task, part of the Test of Everyday Attention (Robertson et al., 1996). • Processing speed: Letter Digit Substitution Test (Van der Elst et al., 2006) • Text Reception Threshold: visual analogue of the speech perception in noise task (Zekveld et al., 2007). AMN Quiet SSN AMN Quiet SSN Fig. 5 Boxplots of response magnitude (left) and stimulus-to-response lag (right) in quiet, steady-state noise, and amplitude-modulated noise Fig. 4 Power spectra of the FFRs in quiet (red), steady-state noise (black), and amplitude-modulated noise (blue) • Steady-state and amplitude-modulated noise degrade speech encoding • Mixed effects models with participant as random factor • Longer stimulus-to-response lag in noise (t(29) = 8.03, p < .001) • Reduced spectral magnitude at second harmonic (t(29) = -7.47, p < .001) and third harmonic (t(29) = -10.07, p < .001) in noise. • Reduced response magnitude in noise (t(29) = -3.44, p = .001). • Delayed response in steady-state noise compared to quiet (2.3 ms, paired t-test: t(13) = -3.2, p = .007) rms amplitude (dB) 44 46 48 50 52 54 56 Response magnitude Peak Trough AMN AMN Fig. 1 Stimulus timing in continuously presented amplitude-modulated speech-shaped noise. Fig. 6 Boxplots of response magnitude at peak and trough of amplitude-modulated masker Fig. 7 Power spectra of FFR at peak (blue) and trough (red) of amplitude-modulated masker • Speech is differently encoded at peak and trough of amplitude-modulated masker • Mixed effects models with participant as random factor • Reduced spectral magnitude at third harmonic at peak of masker (t(15) = -5.11, p < .001) • Reduced response magnitude at peak of masker (t(15) = -4.5, p < .001). • But increased F0 at peak of masker (t(15) = 4.56, p < .001). • Auditory and cognitive skills do not predict speech perception in noise abilities • Pearson’s correlations • No relationship between SRTs (averaged across SSN and AMN) and any of the electrophysiological or behavioural measures. • No relationship between dip listening ability (SRT in SSN minus SRT in AMN) and any of the electrophysiological or behavioural measures. • Conclusions • Amplitude fluctuations in the masker become apparent at the level of the brainstem. The FFR is more robustly encoded at the trough than at the peak of the masker. • Subcortical encoding cannot explain the variability in SRTs. This casts doubt on the exact role of phase-locking in dip listening and speech perception in noise more generally. • However, neither auditory nor cognitive processes predict speech in noise perception or dip listening skills. This suggests that the amount of variability is simply too small in this group. Scan icon below for a copy of this poster. References 1. Miller, G. A. and Licklider, J. C. R. (1950). The Intelligibility of Interrupted Speech. The Journal of the Acoustical Society of America, 22(2),167-173. 2. Lorenzi, C., Gilbert, G., Carn, H., Garnier, S., and Moore, B. C. J. (2006). Speech perception problems of the hearing impaired reflect inability to use temporal ne structure. PNAS, 103(49), 18866-18869. 3. Song, J. H., Skoe, E., Banai, K., and Kraus, N. (2011). Perception of speech in noise: neural correlates. Journal of cognitive neuroscience, 23(9), 2268-2279. 4. Moore, B. C. J. (2012). The importance of temporal fine structure for the intelligibility of speech in complex backgrounds. In Dau, T., Dalsgaard, J., Jepsen, M., and Poulsen, T., editors, Speech Perception and Auditory Disorders, pages 21-32. Centertryk A/S, Denmark. 5. Davis, M. H. and Johnsrude, I. S. (2007). Hearing speech sounds: top-down influences on the interface between audition and speech perception. Hearing research, 229(1-2),132-47. 6. Rudner, M., Rönnberg, and Lunner, T. (2001). Working memory supports listening in noise for persons with hearing impairment. Journal of the American Academy of Audiology, 22(3), 156 – 167. 7. Robertson, I.H., Ward, T., Ridgeway, V., and Nimmo-Smith, I. (1996). The structure of normal human attention: The Test of Everyday Attention. Journal of the International Neuropsychological Society, 2, 525 – 534. 8. Van der Elst, W., van Boxtel, M.P.J, van Breukelen, G.J.P., and Jolles, J. (2006). The Letter Digit Substitution Test: Normative data for 1,858 healthy participants aged 24 – 81 from the Maastricht Aging Study (MAAS): Influence of Age, Education, and Sex. Journal of Clinical and Experimental Neuropsychology, 28(6), 998 – 1009. 9. Zekveld, A.A., George, E.L.J., Kramer, S.E., Goverts, S.T., and Houtgast, T. (2007). The development of a text reception threshold test: A visual analogue of the speech reception threshold test. Journal of Speech, Language, and Hearing Research, 50, 576 – 584.


