Download
1 / 25
250 likes | 264 Views
This research study examines the spatial relationship between growth and inequality in Israeli cities. It explores the factors that affect the distribution of growth and investigates the role of diversity in the growth-inequality dynamic. The study also analyzes how distance from the center, human capital, entrepreneurship, and other factors influence growth and inequality in Israeli cities.

E N D
Spatial Distribution of Growth and Inequality:The case of Israeli cities Malka Antonio and Daniel Shefer January 2010 Center for Urban and Regional Studies Technion
Growth Substitute Equality Growth Complementary Equality Conflict (?) between two objectives 1. Induce growth 2. Reduce inequality Competing or complementing objectives?
Research questions • Is there a spatial relationship between growth and inequality? • What are the factors that affect the spatial distribution of growth? • Does diversity have a role in the growth/inequality dynamic? • What is the spatial relationship between growth and inequality in Israel?
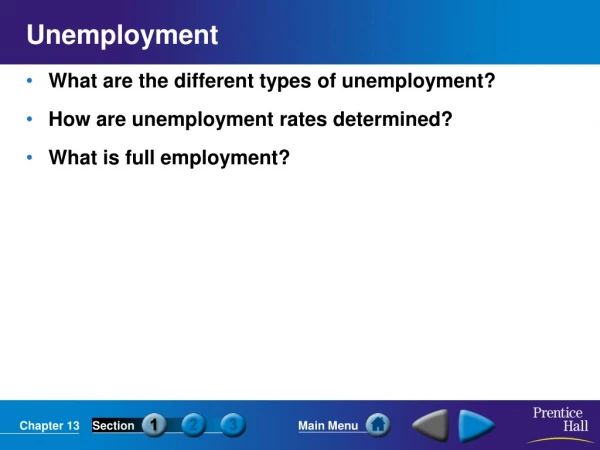
Growth is affected by: Innovation, specialization, trade • The New Economic Geography • Growth – average income, population growth • Distance from Tel Aviv • Human capital – education • Entrepreneurship – self-employment • ICT (Information and Communication Technology) specialization • Unemployment • Inequality
Increase Decrease Diversity Inequality Growth The cyclical, self-reinforcing relationship between growth and inequality is mediated by diversity
Diversity • Diversity creates dynamic places (Jacobs) • The Creative Class Economy (Florida) • Quasi-fixed factors (World Development Report, 2009) • Ease of entry (Chinitz) • Monopolistic competition (a la Chamberlin) – Differentiated products/services and city size (Quigley)
Hypotheses • Diversity increases growth • Growth increases inequality • Diversity increases inequality within cities and decreases inequality between cities/regions • Distance from the center affects income, education, entrepreneurship, population growth, unemployment
Empirical analysis Stage I • General trends for 2006 • Spatial analysis Stage II • Growth and inequality over time • Spatial ICT activities
The relationship between growth factors: Income Education Entrepreneurship – self-employment Socio-economic rank
The relationship between growth and inequality: Gini coefficient Income
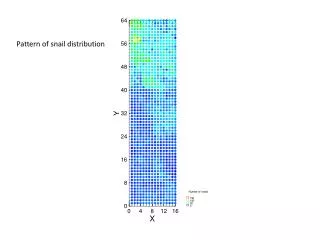
The spatial distribution of growth: Income Population growth Socio-economic rank Self-employment Unemployment
Income >6,000NIS Income <6,000 NIS Total 0-50 km 17 (11.57) 8 (13.43) 25 51-184 km 8 (13.43) 21 (15.57) 29 Total 25 29 54 0.01 t = -4.20 , b1 = -17.65 , R2 = .25
c 2 t = -3.625, b1 = -0.015, R2 = .20
The spatial distribution of inequality Gini coefficient Distance
Inequality Income per capita Discussion • Growth and inequality (between countries)
Conclusions • The impact of inequality depends on scale – within and between cities/regions • Policy recommendations • Investment in transport infrastructure - • Improves labor accessibility to the center • Attracts firms to the periphery • Induces spatial economic integration • Earmark location specific incentive programs to help distressed cities in the center as well as in the periphery