Download
1 / 5
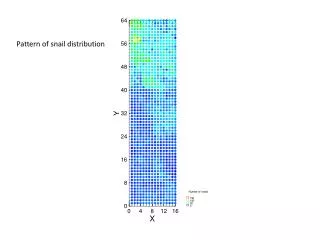
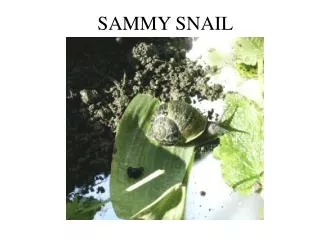
Pattern of snail distribution
50 likes | 193 Views
Pattern of snail distribution. Variance to mean ratio as a function of spatial scale. .0016m 2. 0.625 m 2. .25 m 2. 1 m 2. 4 m 2. Smallest spatial scale (A) – is distribution random?. P=0.00001. Proportion. Long transect 200 meter long sampled every 2 meters . Long transect .
Download Presentation 
Pattern of snail distribution
An Image/Link below is provided (as is) to download presentation
Download Policy: Content on the Website is provided to you AS IS for your information and personal use and may not be sold / licensed / shared on other websites without getting consent from its author.
Content is provided to you AS IS for your information and personal use only.
Download presentation by click this link.
While downloading, if for some reason you are not able to download a presentation, the publisher may have deleted the file from their server.
During download, if you can't get a presentation, the file might be deleted by the publisher.
E N D
Presentation Transcript
Variance to mean ratio as a function of spatial scale .0016m2 0.625 m2 .25 m2 1 m2 4 m2
Smallest spatial scale (A) – is distribution random? P=0.00001 Proportion
Long transect P=0.0001 P=0.130


More Related