Impact of HIV Protease Inhibitors on Intracellular Proteasome Activity in RPMI8226 Cells
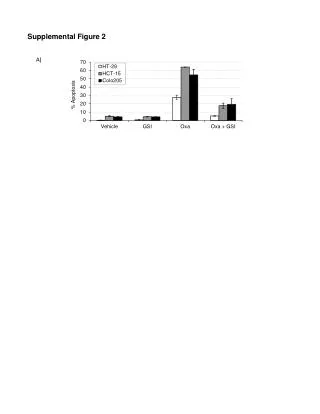
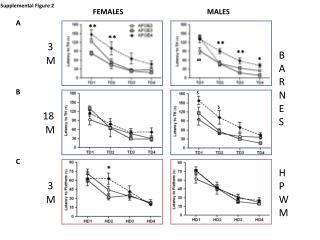
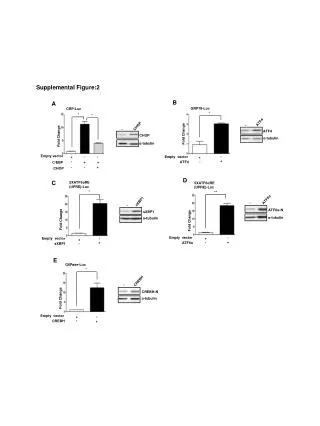
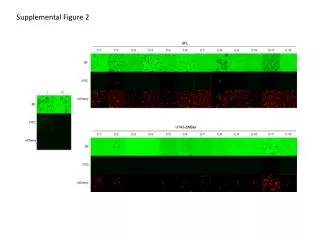
RPMI8226 cells were incubated with various concentrations of HIV protease inhibitors (Amprenavir, Atazanavir, Darunavir, Indinavir, Tipranavir) and proteasome activity was assessed using the MV151 probe. The bar graphs show changes in proteasome subunit-specific fluorescence signals compared to untreated controls. The text includes data on changes in proteasome activity and protein expressions in RPMI8226 cells.

Impact of HIV Protease Inhibitors on Intracellular Proteasome Activity in RPMI8226 Cells
E N D
Presentation Transcript
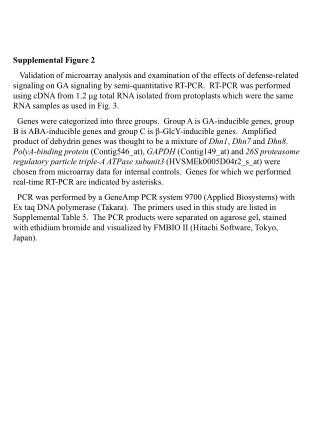
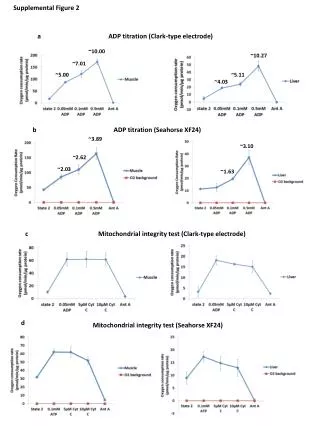
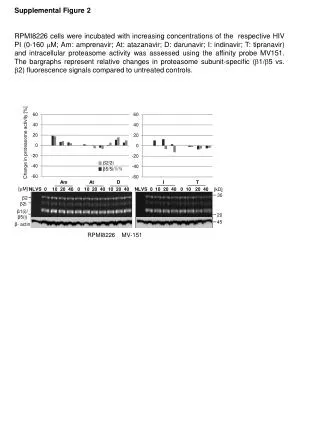
SupplementalFigure 2 RPMI8226 cellswereincubatedwithincreasingconcentrationsoftherespective HIV PI (0-160 mM; Am: amprenavir; At: atazanavir; D: darunavir; I: indinavir; T: tipranavir) andintracellular proteasome activity was assessedusingtheaffinity probe MV151. The bargraphsrepresent relative changes in proteasome subunit-specific (b1/b5 vs. b2) fluorescencesignalscomparedtountreatedcontrols. Change in proteasomeactivity [%] β2/2i β5/5i/1/1i Am At D I T [µM] NLVS 0 10 20 40 0 10 20 40 10 20 40 NLVS 0 10 20 40 0 10 20 40 [kD] β2 β2i 30 β1(i)/β5(i) β- actin 20 RPMI8226 MV-151 45