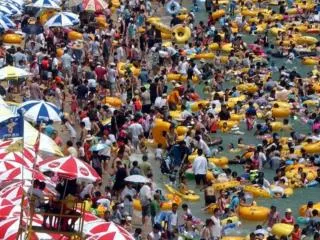
Child population numbers
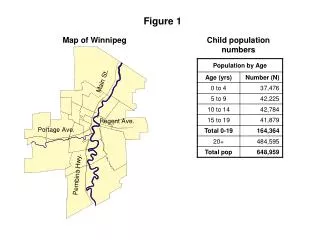
Figure 1. Map of Winnipeg. Child population numbers. Figure 2. Neighbourhood Socioeconomic Status. Winnipeg SES Groups, 2001 Census data. Assessed by: Unemployment rate, Lone parent families, High school education, Female labour force participation. Figure 3.

Child population numbers
E N D
Presentation Transcript
Figure 1 Map of Winnipeg Child population numbers
Figure 2 Neighbourhood Socioeconomic Status Winnipeg SES Groups, 2001 Census data Assessed by: Unemployment rate, Lone parent families, High school education, Female labour force participation
Figure 3 Grade 12 (S4) Performance, by Winnipeg SES Group, Language Arts Standards Test, 2001/02 18 year olds who should have written Pass/Fail rates of test writers
Figure 4High School Completion Rates Grade 9 (S1) students in 1997/98 What happens in next 5 years? N=22 N=358 N=182 N=309
Figure 5High School Completion Rates, by Winnipeg NeighbourhoodGrade 9 (S1) students in 1997/98: What happens in next 5 years? High SES Middle Low-Mid Low SES
Figure 6Grade 3 Performance, by Winnipeg SES Group,Language Arts Standards Test, 1998/99 Pass/Fail rate of test writers Eight year olds who should have written
Figure 7Healthiness of Children at Birth (1984), by Winnipeg SES Group % Children with Normal Birthweight % Children with ‘Good’ Apgar Score Low BW: 5% 6% 4% 3% High BW: 11% 12% 13% 15%
Figure 8Per cent of Grade 1 Students in Reading Recovery Program, by WinnipegSES Group, 2000/01 SES
Figure 9Child Care Spaces for 0 to 12 year olds, by Winnipeg Neighbourhood, 2000 High SES Middle Low- Mid Low SES