Download
1 / 19
200 likes | 307 Views
Discover how GPS Total Electron Content data can detect Tsunami-driven Traveling Ionospheric Disturbances, offering an alternative to costly DART buoy systems. This method enhances theoretical models for early tsunami warnings, utilizing TEC data from IGS stations and GIM algorithm processing at JPL. Real-time GPS data streams from global networks provide valuable insights on tsunami signatures, validated with theoretical models like MOST and Song. The study showcases observations from past tsunamis, such as those in American Samoa and Chile, highlighting the potential of GPS-based ionospheric monitoring for a robust warning system. Acknowledgments to NASA, JPL, NOAA, and other collaborators for their support in tsunami research.

E N D
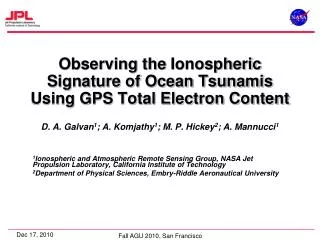
Observing the Ionospheric Signature of Ocean Tsunamis Using GPS Total Electron Content D. A. Galvan1; A. Komjathy1; M. P. Hickey2; A. Mannucci1 1Ionospheric and Atmospheric Remote Sensing Group, NASA Jet Propulsion Laboratory, California Institute of Technology 2Department of Physical Sciences, Embry-Riddle Aeronautical University
Tsunami-driven Traveling Ionospheric Disturbances(TIDs) From Artru et al., 2005
Motivation:Why add ionospheric observations? • DART buoy system is expensive: • ~$250,000 per buoy to build • DART system cost $12 M to maintain/operate in 2009 (28% of NOAA’s total tsunami-related budget)* • Buoys are sparsely distributed, temperamental • Data available 84% of time, outages due to harsh weather, human error* • GPS Receivers are more abundant, multi-use, low-cost • Additional means of observing tsunamis over a broader area could help to validate and improve theoretical model predictions, contributing to tsunami early warning system. *Government Accountability Office (GAO) report, April 2010 http://www.gao.gov/cgi-bin/getrpt?GAO-10-490
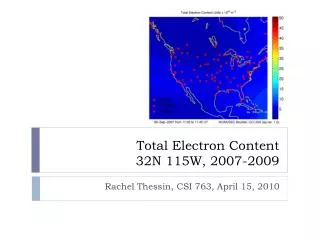
Data Type: Total Electron Content (TEC) from International GNSS System (IGS) stations -30-second TEC data from dual-frequency GPS receivers. -Data processed through Global Ionospheric Mapping (GIM) algorithm at JPL -For simultaneous bias identification/removal (satellite and receiver) ,
Regional Networks GEONET Array Source: Scripps Orbit and Permanent Array Center (SOPAC) GPS Data Archive, UCSD http://sopac.ucsd.edu/cgi-bin/somi4i Source: Japanese GPS Earth Observation Network (GEONET) Array Over 1200 stations http://terras.gsi.go.jp/gps/geonet_top.html
Streaming 1-second data availability Currently up to 130 stations worldwide providing 1-second realtime data. http://www.gdgps.net/, ftp://cddis.gsfc.nasa.gov/pub/gps/data/highrate
Methodology • Estimate arrival time. Use simple 200 m/s projection, model predictions (MOST, Song, etc.) • Process GPS TEC data JPL GIM software. • Apply bi-directional band-pass filter: 0.5 – 5 mHz (33.3 – 3 min period) • Plot filtered TEC as a function of distance/time.
American Samoa Tsunami 9/29/09 Observed at Hawaii Rolland et al., 2010 (GRL) Galvan et al., 2011 (submitted)
American Samoa Tsunami 9/29/09Observed at Hawaii (map plot) Distance from Epicenter Lat UT Sep 29-30, 2009 Lon
Chile Tsunami 2/27/10Observed at Japan Distance from Epicenter UT Sep 29-30, 2009
Theoretical Model Results Ocean Surface Displacement (m) Vertical TEC Spectral full-wave model (SFWM), Hickey et al., 2009, using input wave form from Peltier and Hines, 1976, and period/velocity from DART buoy.
Hickey Model Compared with Data Filtered VTEC (TECU) Universal Time (2/28/2010)
Summary • Tsunami-driven TID’s observed via GPS TEC after the American Samoa Tsunami of 9/29/2009 and the Chilean tsunami of 2/27/2010. (Galvan et al., submitted) • Models predict tsunami-driven TID’s. (Occhipinti et al., 2008; Hickey et al., 2009; Mai and Kiang, 2009). • Observations: Typically ~0.1 – 0.5 TECU. • 30-second archived data AND 1-second real-time data available for study, both ground-based and LEO (COSMIC). • Long-term potential for warning system.
Acknowledgements • NASA ROSES Grant # NNH07ZDA001N-ESI(Tsunami Imaging Using GPS Measurements) • Dr. John LaBrecque (NASA HQ) • Dr. Philip Stephens (JPL) • Dr. VasilyTitov and Dr. Yong Wei (NOAA Center for Tsunami Research) • Dr. James Foster (University of Hawaii) • Dr. Giovanni Occhipinti (IPGP, France)
JPL’s GIM Ionosphere Algorithm • Data-driven vertical TEC maps based on interpolating GPS slant TEC measurements on global scales (1993 – present): • Solar-geomagnetic reference frame • Shell approximation: extended slab (450 km altitude) • Multiple shells (250, 450, & 800 km altitude) • Map slant TEC measurements to equivalent vertical using obliquity factor • Spatial interpolation: Triangular-grid or Bi-cubic splines • Temporal smoothing: stochastic Kalman filter • Vertical TEC at each vertex treated as a random walk parameter • Initialized with Klobuchar, Bent, or IRI95 model • Simultaneously solve for satellite biases (Tgd) and receiver biases