Download
1 / 29
310 likes | 506 Views
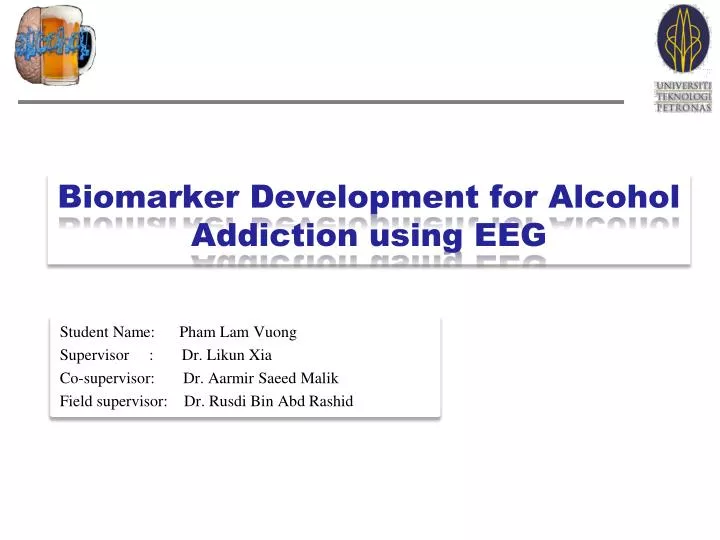
Biomarker Development for Alcohol Addiction using EEG. Student Name: Pham Lam Vuong Supervisor : Dr. Likun Xia Co-supervisor: Dr. Aarmir Saeed Malik Field supervisor: Dr. Rusdi Bin Abd Rashid. 3. Outline. Introduction. 1. Proposed Methodology. 2.

E N D
Biomarker Development for Alcohol Addiction using EEG Student Name: Pham Lam Vuong Supervisor : Dr.Likun Xia Co-supervisor: Dr.AarmirSaeed Malik Field supervisor: Dr.Rusdi Bin Abd Rashid
3 Outline Introduction 1 Proposed Methodology 2 Preliminary Result 5
Harmful effects of Alcohol addiction • unintentional injuries: road traffic accidents, falls, drowning, poisoning … • intentional injuries: violence and self-inflicted injuries • cancers of the colorectal, female breast, larynx, liver, esophagus, oral cavity and pharynx • Alcohol addiction is characterized by an increased tolerance and physical dependence on alcohol that affect individual's ability to control alcohol consumption safely • Harmful effects of alcohol use: • 3.8% of all global deaths each year were attributable to alcohol (about 2.5 million people) [1] • Causal factor in 60 types of diseases and injuries • Component cause in 200 others (30% of road accidents in Malaysia) [2] • Chronic, heavily drinking alters level of neurotransmitters and kills many brain cells ( white cells and grey cells) that causing brain shrinkage [1] WHO. (2011). Global status report on alcohol & health. [2] Assunta M. The alcohol problem in Malaysia. The Globe Special Issue 4.Global Alcohol Policy Alliance, 2001–2002
Alcohol Biomarker • Physiological indicators of alcohol exposure or ingestion and may reflect the presence of an alcohol use disorder • Increase treatment efficiency by • Combining with other screening tools to identify individuals with alcohol-related problems or who are at risk • Evaluating if new intervention has desirable effect by giving outcome measures in earlier stage • Identifying subset of abstainers at highest risk for relapse
Electroencephalogram (EEG) Spectral power Dominant frequency Signal complexity Coherence … • A non-invasive technique that detects electrical impulses in the brain due to neuronal activity using electrodes placed on the patient’s scalp • Frequency-dependent, spontaneous and continuous neural activity • Appear in restful state. • Could be decomposed into bands with different frequencies reflecting different types of brain activities, most commonly:
Problem statement & hypothesis • Problem statement: There is no investigation about capability of EEG for alcohol addiction screening and treatment. • Hypothesis: EEG biomarker will help increase treatment efficiency by determining if medication have a desirable effect much earlier. =>To examine the usefulness of EEG features as biomarker for alcohol addiction treatment. => To develop an EEG biomarker to assist doctors evaluating new medication treatment (compare new medication with old medication).
Proposed methodology - participants • Alcoholics meet criteria of DSM IV and applied for detoxification • Excluded criteria: • Under 18 • Drug addiction (other than alcohol addiction) • Acute medical and psychiatric problems • History allergic to diazepam • Have severity withdrawal symptoms • Refuse consent • Patients who had abstained for more than one day before starting the treatment • 18 participants will be enrolled to two EEG stages: • Pre-treatment: EEG is measured before participants take benzodiazepine • Post-treatment: EEG is measured after participants take benzodiazepine 2 weeks
score AWS RR Screening Diagnosing Outcome 12 weeks Finish detoxification Before treatment Recruitment Detoxification
Experiment degisn Start Eyes-close (5 min) Eyes-open (5 min) End
PRELIMINARY EXPERIMENT Start Eyes-close (5 min) Eyes-open (5 min) End • 17 alcohol users (11 men and 6 women) age 31-83 (mean 55.41 ± 13.86 years) were included in the study and matched with non-alcohol subjects according to age and gender. • The participants were evaluated by physician using Alcohol Use Disorders Identification Test (AUDIT). • Participants were assign to alcohol users if: • Have alcohol-related problem in the past year • Have first three AUDIT ≥ 4
Spectral power The electrodes which have significant different between alcoholics and controls are chosen. Formula for independent t-test calculation:
Statistical Probability Map 14/16 (87.5%) cases P<0.05 12/16 (75%) cases P<0.001 Maps of EEG absolute power differences between alcoholics and normal controls in eyes-close (EO) state Maps of EEG relative power differences between alcoholics and normal controls in eyes-close (EO) state
Hjorth features The Hjorth’s mobility feature is obtained from the first derivative of EEG fluctuation. It shows the rate of change of signal’s amplitude. The Hjorth’s complexity feature is obtained from the second derivative of EEG fluctuation. It shows the peaks and troughs of signal.
Hjorth Features • Hjorth’s mobility and complexity
CPEI features The EEG waveform can be described as a sequence of ordinal patterns. The permutation entropy (PE) describes the relative occurrence of each of these patterns. A composite PE index (CPEI) was developed, which was the sum of two simple PEs
CPEI Feature • CPEI features in EC stage and EO stage
CLASSIFICATION RESULT Random forest (AUC=0.7291) Discriminant analysis (AUC=0.6542) Decision Tree (AUC=0.6312)
SUMMARY & RECOMMENDATION • There was a decrease in brain electrical activity and the slowing of the predominant frequency in chronic and heavy alcohol users, most significant in occipital and parietal regions. • CPEI features showed high power of classification between alcohol users and non-alcohol subjects with less dependence on timing and noise during recording. Above classification results can be improve by selecting more suitable features for classification. • The results still might be highly inaccurate due to our large sources of bias. The high variance can be reduced by increasing sample size with suitable range of biological characteristic.
Asymmetry, coherence and phase delay Asymetry: difference power between 2 regions Asym = [(A-B)/(A+B)] Coherence is a measure of the degree of association or coupling of frequency spectra between two different time series Phase delays are a measure of the temporal lead or lag of spectra