Surface Analysis Tools
Surface Analysis Tools. Lesson 7 overview. Topographic data Sources Uses Topographic analysis Hillshade Visibility Contours Slope, aspect, and curvature Exercise 8. Road map — Surface analysis tools. R. Surface. DEM. Conversion. Before Surface. Cut/Fill. R. After Surface.

Surface Analysis Tools
E N D
Presentation Transcript
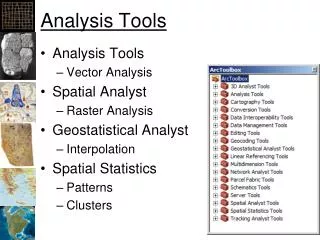
Lesson 7 overview • Topographic data • Sources • Uses • Topographic analysis • Hillshade • Visibility • Contours • Slope, aspect, and curvature • Exercise 8
Road map — Surface analysis tools R Surface DEM Conversion Before Surface Cut/Fill R After Surface Aspect R Slope R Hillshade R Curvature R Curvature Profile R Plan Curve R Contour F Point F Raster R Observer Points R R Viewshed Surface Feature Class R F Point or Polyline F
Sources of topographic data • US Federal Government • United States Geological Survey (USGS): OEM • Several resolutions • National Elevation Dataset (NED) • National Imagery and Mapping Agency (NIMA): DTED
Surface conversion • Convert surface formats into rasters • ASCII to Raster • DEM to Raster (Digital Elevation Model) • DTED (Digital Terrain Elevation Data) is a direct read format for ArcGIS • Output name with no extension returns a grid
Using surfaces in ArcGIS Spatial Analyst • • ArcGIS Spatial Analyst provides tools to derive • • Also hydrologic modeling Hillshade Aspect Contour Slope Curvature
Contouring • Isolines connect locations of equal value • Generate contour lines from a surface • May specify contour interval and base contour
Rise tan θ = Run Derive slope • Maximum rate of change of Z through the cell • Uses neighboring cell Z values • Returns degrees or percent
0 N 90 270 W E S 180 Derive aspect • Direction of the maximum rate of change in Z • Orientation of cell relative to north • Returns compass direction 0 to 360 • Flat areas are given a value of -1
Hillshade • Illuminates a surface • Sets sun position • Returns gray scale 0 - 255 • Cartographic and analytic uses
Visibility analysis • Visibility of cells from observation points or lines • Output attributes identify observer count or ID
Visibility outputs • FREQUENCY (Viewshed tool) • No limit to the number of observation points • OBSERVERS (Observer Points tool) • Only with the POINT option • When number of observation points LE 16 Point F Observer Points R R Viewshed Surface R Point or Polyline F