Download
1 / 25
250 likes | 385 Views
In this presentation from the Lubbock Severe Weather Conference, Dr. Charles A. Doswell III delves into the importance of meaningful surface analysis for weather diagnosis and forecasting. He discusses the Norwegian School's conceptual model of extratropical cyclones, explores the complexities of frontal analysis, and highlights the significance of moisture, instability, and lifting in severe convective weather. Additionally, he emphasizes the role of teamwork in effective forecasting and the necessity of continuous monitoring and accurate diagnoses to improve short-term forecasts.

E N D
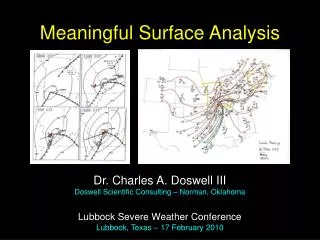
Meaningful Surface Analysis Dr. Charles A. Doswell III Doswell Scientific Consulting – Norman, Oklahoma Lubbock Severe Weather Conference Lubbock, Texas – 17 February 2010
What does meaningful mean? • Helps with the diagnosis of the current weather situation • Critical to a scientific understanding • Forecast = diagnosis + trend • Formal: Q is a forecast quantity
Surface analysis • The industry standard:
The standard analysis • The “Norwegian School” Conceptual model of an extratropical cyclone (ETC) – low pressure • Polar Front model was an essential element • Cold fronts, warm fronts, occluded fronts • Definition of a front: a 1st order discontinuity in density • The line on a map - on the warm side of a baroclinic zone (large thermal gradient)
Dropping isotherm analysis … • [surface temperature] is often neither representative nor conservative. It is not representative because of many local or orographic influences, and it is not conservative on account of the preponderance of nonadiabatic irreversible processes in the air closest to the earth’s surface. Petterssen (1940) – Weather Analysis and Forecasting
Evolution of this concept • Secondary characteristics • Cyclonic wind shift across a front • A “kink” in the isobars • Airmass boundaries • Drylines – moisture discontinuities • Outflow boundaries • Land/sea breeze fronts • Others: gravity waves, density currents, etc. • Weakly baroclinic troughs in the pressure field
Uncertainty in frontal analysis Uccellini et al. (1992 AMS Bull.)
An ensemble of analyses … • It may be inevitable … but good or bad? • Standard isobars + fronts • Isotherms and isodrosotherms • Pressure changes • Consensus is right most of the time – why? • Diversity of plausible ideas is valuable • Low probability, high-impact event potential • Analysis and forecasting as a team activity
Surface analysis and severe weather • A simplified version … Ingredients for severe convective weather: • Deep moist convection … ingredients: • Moisture • Instability (conditionally unstable lapse rates) • Lift • Supercell-based severe convective weather • Vertical wind shear • Non-supercellular severe convective weather • ?? }CAPE
Manually-analyzed surface features • Boundaries • Fronts (baroclinic, by definition) • Drylines (baroclinity is a function of time of day) • Windshifts (weakly baroclinic) • Other … sea breeze fronts, gravity waves, etc. • Thermal features (q is preferred) • Moisture (r is preferred) • Pressure changes (effects on surface wind)
Diagnosis of features • Diagnosis – interpretation of data in terms of physical processes • Bad diagnosis usually bad short-term forecast • Use of all available information • Any interpretation of the data is necessarily provisional … the best you can do at the time • Recognition of bad data
Maddox’s Requirements for Making a Short-Term Forecast • An accurate diagnosis, including continuousmonitoring, of the current situation • An extensive physical understanding of the phenomena occurring, including any anticipated developments
Triple points … Ingredients: Moisture, Instability, Lift, Vertical wind shear
Objective analysis aids • What’s the purpose of manual analysis? • What do you obtain from machine analysis? • Many variables of interest aren’t easily produced for hand analysis (divergence, vorticity, etc.) • Keep the notion of ingredients in mind, though • Machine analysis is consistent (reproducible) • Fast and requires no personal effort at all • Something of a 2-edged sword
Indices and parameters Source: SPC
What can sfc diagnosis do for you? • Not perfect forecasts! • Keeps you connected to the data • Forces you to think like a meteorologist, not a technician • Pattern recognition • Ingredients-based thinking
Principles of team forecasting • Don’t bring your ego to the office! • No one is always right and no one is always wrong • Disagreement is fine, but keep it scientific, not personal • No one succeeds when any one of you fails to do a good job • Shift change is a critical time • Listen carefully and ask questions, if necessary • Ever inherited a mess from the previous shift? • Ever leave your relief with a mess?
Surface analysis as a briefing tool • Surface analysis generally is idiosyncratic • Every few hours, and especially just prior to a shift change, a “standard” surface analysis should be created • Record of your diagnosis and how it has evolved • A fast way to illustrate your concept of what is going on • Everyone should agree on its format
Thank you!! • cdoswell@earthlink.net • http://www.flame.org/~cdoswell • Essays • Publications • Blog link