Download
1 / 99
990 likes | 1.09k Views
Presentation addressing no vote responses, enabling affirmative vote for standardization. Technical analysis, simulations, and measurements discussed.

E N D
Project: IEEE P802.15 Working Group for Wireless Personal Area Networks (WPANs) Submission Title: [MB-OFDM No Vote Responses] Date Submitted: [Nov 15, 2004] Source: [Matthew B. Shoemake and John Terry, Joy Kelly and Jim Lansford, David Leeper and Jeff Forrester, Joe Decuir, Charles Razzell] Company [WiQuest, Alereon, Intel, MCCI, Philips] Address [8 Prestige Circle, Suite 110, Allen, Texas 75013] Voice:[+1 214-547-1600], FAX: [+1 214-547-1606] E-Mail:[Provided throughout document] Re: [IEEE 802.15.3a No Vote Responses from September 2004 Vote] Abstract: [This presentation contains no vote responses to comments submitted after the IEEE 802.15.3a downselect vote in September 2004. These responses have been complied by multiple supporters of the Multiband OFDM approach as indicated throughout the document.] Purpose: [The purpose of this presentation is to address no vote responses thereby enabling an affirmative vote during the confirmation step and thereby enabling IEEE 802.15.3a to move forward into the working group balloting stage of standardization.] Notice: This document has been prepared to assist the IEEE P802.15. It is offered as a basis for discussion and is not binding on the contributing individual(s) or organization(s). The material in this document is subject to change in form and content after further study. The contributor(s) reserve(s) the right to add, amend or withdraw material contained herein. Release: The contributor acknowledges and accepts that this contribution becomes the property of IEEE and may be made publicly available by P802.15.
Outline • Introduction – Matthew Shoemake, WiQuest • Regulatory Compliance and Interference – Joy Kelly, Alereon • MAC – Matthew Shoemake • Location Awareness – Joe Decuir, MCCI • Harmonization or Coexistence – David Leeper, Intel • Multipath / Range Performance – Charles Razzell, Philips • Complexity / Power Consumption / Scalability • Time to Market – Jim Lansford, Alereon • Summary
Regulatory Compliance and Interference Charles Razzell, Philips, charles.razzell@philips.com Jeff Foerster, Intel, jeffrey.r.foerster@intel.com Joy Kelly, Alereon, joy.kelly@alereon.com
Overview of FCC Compliance / Interference Section • Many no vote comments have been elaborated on in reply comments made in response to the MBOA waiver request • Following slides review significant points raised and provide technical analysis, simulations, lab measurements, and field measurements demonstrating that • MB-OFDM waveforms, as proposed in the Waiver, will not cause greater interference than waveforms already allowed by rules • This body of work is precisely what was requested by FCC/OET (i.e. to demonstrate no greater interference potential than waveforms allowed by the rules) • MB-OFDM devices operating under the proposed Waiver will comply with the Part 15f limits on peak and average power
Summary of main opposing comments & claims • MB-OFDM will increase the potential for interference • Not true, as will be shown here • Granting the Waiver will give MB-OFDM an unfair advantage (increased range) relative to other UWB technologies • Not true, even by opposer’s claims • Waiver will ‘open the door’ to other systems seeking relief from the rules • Scope of Waiver is narrow and does not impact most of the FCC rules • FCC should wait for more data and delay making a ruling • Reply comments provide comprehensive data; no new information will come from more tests on the 3-band MB-OFDM waveforms • Waiver is not in the public interest and will negatively impact small businesses • MBOA SIG represents 170+ companies, including many small start-ups
Summary of main opposing comments & claims • MBOA technical justification is filled with errors • Inclusion of WGN in comparisons ‘masks’ MB-OFDM interference potential • Thermal noise and other interference sources are a reality • Wrong BER operating point • BER criterion based on quasi-error free performance • Field measurements are invalid • Same position and separation distance tests are valid and reflect real systems • Simulations results are wrong because they included noise • Noise is a reality and simulation results are supported by lab and field measurements • APD analysis is erroneous • Shown to be technically accurate using NTIA code
Summary of technical points • No greater interference than systems allowed by FCC rules • All UWB signals will be well below the system noise floor of C-band satellite receivers • Makes differences between waveforms negligible • MB-OFDM looks like WGN to narrow bandwidth systems (less than a few MHz), including OFDM systems with narrow tone spacing • MB-OFDM systems do not synchronize and will not increase the potential for aggregation of interference • MB-OFDM has been consistently shown to have less interference than a class of impulse radios allowed by the rules, supported by analysis, simulations, lab measurements, and field measurements • Differences between all UWB signals allowed by the rules are within a few dBs when measured in realistic scenarios • Bandwidth of information-carrying tones is 503.25 MHz
Summary of technical points (cont) • MB-OFDM technology advantages • Band switching (the multi-band concept) • increases frequency diversity • provides coarse spectrum flexibility at Tx • enables efficient CMOS designs • provides protection from strong interferers at Rx • OFDM • efficiently captures multipath energy, • shares common components with other technologies (WiFi, WiMax, DSL) leveraging best known methods in design and manufacturing, • provides fine spectrum flexibility at Tx, and • enables efficient signal processing techniques for interference mitigation in Rx • Spectrum flexibility will be necessary to enable worldwide interoperability and to adapt to future spectrum allocations
No greater interference:C-band satellites802.11a devices Other UWB devices No risk of aggregation
C-band Satellites Table 1: Power spectral density limits for some US government bands • C-band satellite systems have little margin • MBOA field measurements have confirmed this (only 2.5 dB margin)
C-band Satellites (cont) • C-band satellites have low margin due to challenges of communicating over long satellite link (see Petition for reconsideration of Satellite Industry Association in docket 98-153) • Low margin requires interference to be below systems noise floor of C-band satellite receiver • What is system noise floor for C-band satellites? • From SIA, Isat is defined as the interference at a given C-band receiver caused by adjacent C-band channel interference and cross polarization noise from the satellite link • Isat/N = 1.4 dB (1.38) • N_sys = N + I_sat where N is the thermal noise floor • FCC adopted criterion of IUWB /N < 0 dB (docket 98-153 March 12, 2003) • N_sys = N + I_sat = (1 + 1.38)= 2.38 • IUWB /N_sys = 10*log10(1/2.38) = -3.8dB
C-band Satellites (cont) • FCC criterion, when incorporating total satellite system noise experienced (as defined by SIA) is thus IUWB /N_sys = -3.8dB • Further support of appropriate protection levels for C-band satellites • XtremeSpectrum filed response to SIA Petition for Reconsideration (Sept 4, 2003 in docket 98-153) stating that • “Using SIA’s stated operating levels, XSI [now part of Freescale] demonstrates that an I/N of –6 dB assigned to a UWB device is an appropriate protection level” • IUWB /N = -6 dB IUWB /N_sys = -9.8dB
C-band Satellites (cont) • Simulation results from an Alion report presented to FCC (Feb 11, 2004) • Based on simulation results, coalition of C-band constituents proposed reducing current FCC limits by 21dB (98-153 & 02-380 February 18, 2004) • Motorola (in ET Docket No. 98-153, April 9, 2004) provided analysis in response to Alion report which took into account more realistic factors into the simulations. Motorola concluded that • ”Based on the revised simulations with the more realistic path loss models, building blockage effects for devices of high in the air (and near the antenna main beam), the inclusion of a realistic duty cycle (<10%) and realistic density projections, it is clear that no significant interference will result. The aggregate UWB signal power levels drop by 25-60 dB when more realistic assumptions are made in the simulations.”
C-band Satellites (cont) • UWB average interference power will be well below system noise floor when considering realistic deployment scenarios • When I/Nsys << 0 dB, simulations, lab measurements, and field measurements show little difference between MB-OFDM, impulse, and DS-UWB waveforms • Results also consistently show MB-OFDM causes less interference than impulse radios already allowed by the rules
C-band Satellites (cont) • Supporting analysis from other companies • Freescale commented that “…when you mix one part MB-OFDM energy with 20 parts Gaussian noise, the result is a composite signal that looks very much like noise.” • TimeDerivative commented that “At very low I/N ratios the noise dominates and little can be said about the difference between various interferers.” This is precisely the point: to simulate, analyze, and measure the interference potential of alternative UWB waveform typesin a realistic operating environment
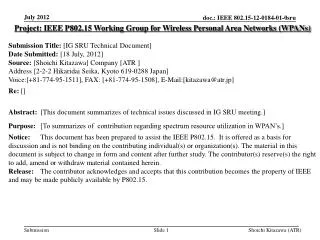
MBOA C-band Satellite field test results • Field test objectives • Measure interference potential to C-band TV service operating in the FSS C-band 3.7-4.2GHz • Compare White Gaussian Noise (WGN), MB-OFDM & Impulse UWB signals • Quantify relative interference potential of each UWB signal • Determine safe distance from dish antenna to avoid interference • Two separate tests were conducted. • First test: compared the different UWB signals in terms interference potential to the FSS receiving system. • Second test: determined the safe distance from the dish that must be maintained to avoid interference to the FSS receiver
MBOA C-band Satellite field test results • Same position testing • Set UWB emissions to -41.3 dBm/MHz for each waveform type • Measure interference power of each UWB waveform type required to yield visible block artifacts on TV monitor • Interference power measurement to produce visible block artifacts accurate to within 0.1 dB • Shows relative differences between waveforms • Devices being in ‘near-field’ of antenna is irrelevant • Separation distance testing • Devices had to be very close to antenna (in the ‘near-field’) to see measurable interference levels • Results are not ‘random’ and show UWB devices must be very close before interference is measurable
MBOA C-band Satellite field test results: Same Position Testing • MB-OFDM has less interference than impulse radio and within 1-1.6 dB from WGN • Simulations and lab measurements support this result
MBOA C-band Satellite field test results:Safe Distance Tests MB-OFDM WGN Dish Orientation Scale in feet
Interference to 802.11a • interference measurements were conducted, using an IEEE802.11a device • Two types of the interfering signals were considered • MB-OFDM signal • AWGN
802.11a Interference Data Source Source Digital at RF at RF Scope Adjustable Adjustable Gain Gain 802.11a AWGN BER Receiver Channel Tester (Radio + PHY) Digital Scope Test Set-up for Interference Measurements to 802.11a
Test Description • An IEEE802.11a device was configured with the data-rate of 36 Mbps (16 QAM, R=3/4) • The IEEE802.11a signal power was calibrated to the sensitivity level (0 dB at BER=10-5) in the absence of the interference. • This defines the operation thermal noise level. • IEEE802.11a signal level was adjusted to different levels in order to measure the impact of the interference signal and its power. • With the interference added to the calibrated thermal noise, its power level (maximum tolerable interference power (MTIP)) was measured to maintain the IEEE802.11a reception at BER=10-5.
Interference to 802.11a Measurement results • MB-OFDM produces no more interference to IEEE 802.11a WLANs than AWGN • 802.11a is OFDM based and uses symbol periods of 4 usec • This results in integration over several MB-OFDM symbols, so only average interference power matters
802.11a AGC Performance in the Presence of MB-OFDM Transmission • Contention that the MB-OFDM signal would cause performance degradation of the AGC in the IEEE802.11a receiver. • Comparison was made in the IEEE802.11a packet detection and the AGC convergence performances between the MB-OFDM signal and AWGN. • Measurement was conducted with the IEEE802.11a device operating at 3 dB above sensitivity. • conducted with the MB-OFDM signal level set to the MTIP level as well as to 10 dB higher than the MTIP level. • There was no detectable impact whatsoever of the MB-OFDM signal to the IEEE802.11a packet detection and AGC performance.
SIFS Start of Packet AGC Locked Packet Detected Packet Detected MB-OFDM Interferer AWGN Interferer 802.11a Packet Detection & AGC Performance in Presence of AWGN & MB-OFDM Interference
MB-OFDM Interference Impacts to 802.11a Systems: Conclusions Measurement results already presented to this IEEE body confirm that: • MB-OFDM signal and AWGN have similar interference impact to IEEE802.11a receiver • MB-OFDM signal does not adversely affect packet detection and AGC convergence performance of IEEE802.11a devices
Opponents’ Claims regarding MB-OFDM Interference to other UWB systems • Freescale states (4.4.2, p. 23 of “Technical Analysis …”): ‘Other UWB receivers will be injured by the MB-OFDM emissions at least as much and often more than all the other victim systems since their bandwidths are so similar. While on its face, one would expect the 6dB higher emission limits to single out MB-OFDM devices for a 2X range advantage, the actual outcome is even worse. The noise floor of all other UWB devices would be raised far more by MB-OFDM devices than other classes of UWB devices.’ • Pulse-Link states in Section III of their “Comments …” : ‘Granting the waiver would allow the MBOA radio to more successfully jam the DS-UWB radio since it will be allowed an increase of power in band.’ • TimeDerivative states: ‘This additional power poses a significant additional risk to other UWB communications equipment.’ No evidence has been shown to support these claims.
Reality: MB-OFDM Interference to other UWB systems • On the contrary, consider the following example: • Assume an MB-OFDM signal which occupies a total bandwidth of 3*528 = 1584 MHz • peak power spectral density (PSD) during the OFDM symbol ‘on’ time is 5.8 dB above average PSD • occupied bandwidth of one symbol is ~500 MHz. • Evaluate interference experienced due to this signal by an impulse radio system occupying the same total bandwidth of 1584 MHz (for comparison, Freescale’s proposed DS-UWB system defines impulse radio modulation using impulses of bandwidth 1320 MHz and a PRF of 220 MHz to deliver a data rate of 110 Mbps.). • Assume interference much higher than system noise.
Reality: MB-OFDM Interference to other UWB systems • At any given instant, one 500 MHz portion of impulse radio’s occupied band is impacted by an MB-OFDM symbol • Impulse radio receiver matched filter integrates all interference power over the full bandwidth of 1584 MHz. • Thus, the total instantaneous interferer power[1] at the output of a 1584 MHz matched filter is • IMB-OFDM = (-41.3 + 5.8) dBm/MHz + 10*log10(500) MHz = -8.5 dBm • [1]Instantaneous interference power refers to the maximum interference power to be expected while the interference source is active or ‘on’.
Reality: MB-OFDM Interference to other UWB systems • total instantaneous interferer power at the matched filter output from another impulse UWB radio system occupying the same 1584 MHz bandwidth would be • IDS-UWB = (-41.3) + 10*log10(1584) = -9.3 dBm • MB-OFDM system offers at worst 0.8 dB higher potential interference in this example • Furthermore, if we consider a more realistic set of conditions, this modest impact would be reduced still further. • including system noise in addition to the interference • Accounting for target DS-UWB system FEC protection
MB-OFDM systems will not increase aggregate interference levels • Freescale and others claim a MBOA device “seeks out and transmits on channels momentarily left vacant by others” • This requires nanosecond time-scale synchronization between devices belonging to different networks: NOT facilitated by MBOA protocols • Uncoordinated MBOA devices pick different time-frequency codes (TFC) using similar protocols as other UWB devices do in order to select logical channels corresponding to their PHYs • timing offsets between uncoordinated devices are random • timing drifts between uncoordinated devices further randomize emissions Unrealistic fine-scale Synchronization: NOT facilitated for MBOA devices belonging to different networks Aggregation results for MB-OFDM devices are no different than those for pulse based UWB devices
No greater interference:Comparisons of various UWB waveforms impact to a generic wideband DVB receiver
Victim Receiver • The victim receiver chosen for study was a Digital Video Broadcasting receiver with the following characteristics: • QPSK modulation with a transmission symbol rate RS of 33 Msymbols/second • Root Raised Cosine Filtering at Tx and Rx • Viterbi FEC, with rates of 1/2, 2/3, 3/4, 5/6 and 7/8. • Representative of the most vulnerable class of victim receivers • Very wide bandwidth and low error rate requirement • BER at output of Viterbi decoder for comparisons = 2 x 10⁻⁴ (Quasi-error free operating point for satellite systems employing standard concatenated code)
BER Criterion for Digital Video • Freescale claims that the MBOA analysis is based upon the wrong BER criterion and stated that the BER used in our comparisons were ‘7 orders of magnitude higher than the specification’. They claimed that ‘the curves and corresponding conclusions are misleading, and to a skilled communications engineer, they are fatally flawed and have no technical merit.’ • It is well-known that digital video needs a low BER. • it is also well-known that a BER of 2 x 10⁻⁴ at the output of the Viterbi decoder yields quasi-error free performance at the output of the Reed-Solomon decoder (meaning a BER of 10-10 to 10-11)[1]. • Therefore, comparing the performance at the output of the Viterbi decoder at a BER of greater than or equal 2 x 10⁻⁴ is completely relevant to this discussion
Fundamental assumptions:What is the right BER criterion? • MBOA, Freescale, and TimeDerivative each proposed different BER operating points to do comparisons • Alion studies, MBOA studies, and Motorola studies all used digital C-band satellite equipment employing the same FEC as described in ETSI EN 300 421 V1.1.2 • Requirements suggest interference impacts would occur somewhere above a BER of 2 x 10⁻⁴ after the Viterbi decoder • MBOA has provided substantial data at this operating point as well as at other operating points *The following table and text is copied from ETSI EN 300 421 V1.1.2
Fundamental assumptions: System Noise must be considered in the analysis • MBOA and Freescale have a fundamental difference of opinion with respect to inclusion of system noise in comparisons of different waveforms • MBOA position is simple: • System noise is a reality…why ignore it? • System noise = thermal noise + intra-system interference • When average UWB interference power is well below the system noise floor, differences between UWB waveforms are negligible (even Freescale agrees) • Even at moderate I/N levels, differences between various UWB waveforms are small • Misleading conclusions result when not considering realistic environments • Differences between waveforms are highly exaggerated when measured in unrealistic, noise-less environments System noise must be considered in any interference analysis
-2 10 -3 10 -4 10 -5 10 -6 10 -2 0 2 4 6 8 10 Noiseless 7/8-Rate Coded Results INTERFERER ONLY: NO THERMAL NOISE! Impulse radio at 1MHz PRF 0 10 -1 10 MB-OFDM 1,1,3,3,2,2 7/8-rate coded QPSK BER MB-OFDM 1,2,3,1,2,3 impulse simulation MB-OFDM 1,2,3,1,2,3 WGN noise only MB-OFDM 1,1,3,3,2,2, WGN only Eb/Io [dB] Why was the impulse-induced error rate not completely corrected by the FEC? Easily explained by looking at free distance of code and collision properties
X: 1633 4 Y: 4.546 3 2 X: 2145 Y: 0.7067 1 0 -1 X: 1633 Y: -0.7079 -2 -3 X: 2145 -4 Y: -4.546 1600 1700 1800 1900 2000 2100 2200 2300 2400 Impulsive Interference and FEC Real part of received QPSK waveform • At equal power levels, impulse amplitude is 16dB greater than wanted QPSK signal. • Soft decisions associated with collisions will be highly confident (and wrong). • Impulse interference “pollution” of the Viterbi path metrics may last for quite some time and cause an associated error burst. • The duration of the negative impact of an impulse is much longer than that of the impacted bits, especially where Viterbi decoding with soft metrics is used. • Soft decisions must be clipped in magnitude to prevent excessive error propagation. Real part Interfering Impulse
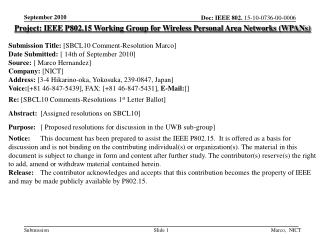
-2 10 -3 10 -4 10 -5 10 -6 10 -1 0 1 2 3 4 5 6 7 8 ¾-rate Coded Results (with noise) I/Nsys = -10.0, soft metric clipping At I/Nsys=-10dB, there is very little difference between the impact of extra Gaussian noise and any of the other types of interference studied. # XSI (now Freescale) filed comments in support of this I/N level: “Using SIA’s stated operating levels, XSI demonstrates that an I/N of –6 dB assigned to a UWB device is an appropriate protection level.” I/N=-6 dB corresponds to I/Nsys=-10 dB 0 10 impulse simulation MB-OFDM 1,2,3,1,2,3, WGN noise + WGN int. -1 10 MB-OFDM 1,1,3,3,2,2, 0.75-rate coded QPSK BER Eb/No [dB] Nsys = thermal noise + intra-system interference
-1 10 -2 10 -3 10 -4 10 1 2 3 4 5 6 7 8 9 ¾-rate Coded Results (with noise) I/Nsys = -5.0, soft metric clipping 0 10 At I/Nsys=-5dB, we begin to see a clear ordering, with the impulse radio being the worst case. The spread, however, is only 1dB. this is quite a severe case, requiring very close proximity to the victim satellite receiver dish. impulse simulation MB-OFDM 1,2,3,1,2,3, WGN noise + WGN int. MB-OFDM 1,1,3,3,2,2, 0.75-rate coded QPSK BER Eb/No [dB]
-2 10 -3 10 -4 10 -5 10 -6 10 3 4 5 6 7 8 9 10 11 12 ¾-rate Coded Results (with noise) I/Nsys = 0.0, soft metric clipping 0 10 At I/Nsys=0dB, the same ordering is maintained, with the impulse radio being the (co-equal) worst case. This is a highly exaggerated and very unlikely case, considering that even the White Gaussian interferer has reduced the available link margin by 3dB, enough to cause link failure in many installations. impulse simulation MB-OFDM 1,2,3,1,2,3, WGN noise + WGN int. -1 10 MB-OFDM 1,1,3,3,2,2, 0.75-rate coded QPSK BER Eb/No [dB]
½-rate Coded Results (with noise) I/N = 0.0, soft metric clipping This is (again) a highly exaggerated and very unlikely case, considering that even the White Gaussian interferer has reduced the available link margin by 3dB, enough to cause link failure in many installations. Nevertheless, the spread in susceptibility to the various waveforms is <2.1dB at the target BER of 2x10⁻⁴. impulse simulation MB-OFDM 1,2,3,1,2,3 WGN noise only -1 10 MB-OFDM 1,1,3,3,2,2, -2 10 ½-rate coded QPSK BER -3 10 -4 10 1 2 3 4 5 6 7 8 9 10 Eb/No [dB]
I/N = -5.0, soft metric clipping impulse simulation -1 10 MB-OFDM 1,2,3,1,2,3 WGN noise only MB-OFDM 1,1,3,3,2,2, -2 10 ½ - rate coded QPSK BER -3 10 -4 10 1 2 3 4 5 6 7 8 9 10 Eb/No [dB] ½-rate Coded Results (with noise) The ability of the FEC to deal with impulsive interference depends on its strength. With a very strong FEC, such as the ½-rate code used here (dfree=10), it can happen that the impulsive interference is better tolerated than the MB-OFDM waveforms. However, the absolute difference remains small (the spread between all waveforms is less than 1dB). Differences of ~ 2 dB or less are WITHIN measurement tolerance of instrumentation
Iuwb /( N + Isat ) - 15 - 10 - 5 0 1 . 00 E - 02 AWGN 1 . 00 E - 03 CP MB - OFDM ZP MB - OFDM Viterbi BER Pulse 1 M 1 . 00 E - 04 Pulse 3 M 1 . 00 E - 05 LAB Measurement Results • Results show that the order of interference impact starting with most benign is: • AWGN • 3MHz PRF impulses • Cyclic Prefix MB-OFDM • Zero Prefix MB-OFDM • 1MHz PRF impulses Relative impact and degree of impact from lab measurements resemble those from the simulations.
Conclusions on Interference Impact on Wideband DVB Receiver • For rate ¾ and 7/8 codes, MB-OFDM is more benign than a 1MHz impulse radio. • Our simulations and measurements focused mainly on the ¾-rate code as being a representative choice from the available rates [1/2, 2/3, 3/4, 5/6, 7/8]. • Low rate codes (½-rate code, for example) are slightly more tolerant to the 1MHz PRF impulses than to MB-OFDM waveforms • Differences are still small among all the waveforms, when realistic I/Nsys ratios are used. • Interference analysis with a low rate code is not representative of a ‘worst-case’ situation (i.e., a UWB device needs to be much closer to a victim using a low rate code compared a victim using a high rate code) Under realistic, worst-case scenarios, MB-OFDM produces consistently less interference than a class of impulse radios already allowed by the rules
APD Analysis • APD plots have been used by the NTIA in the course of interference studies and have been described as “a very informative measurand.” (See NTIA Report 01-383.) • It is important to be aware of the limitations of APD plots, and we agree that they are not susceptibility tests and should be viewed in conjunction with detailed simulations, lab measurements, and field measurements supplied by the MBOA. • However, we do still value APD plots (as does the NTIA) for their ability to describe the potency of an interfering waveform, irrespective of the particular modulation and channel coding scheme used
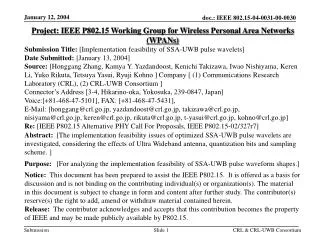
Variation with I/Nsys ratio 20 • The plotted curves all show rather high (and in some cases extremely high) I/N ratios. • In order to observe differences in susceptibility of as much as 5dB relative to AWGN: • The I/N ratio must be at least 8dB AND • The receiver must respond to peak events with a probability as low 10-6 AND • The bandwidth of the victim must exceed 16MHz MB-OFDM I/N= -6.0 dB MB-OFDM I/N= -3.5 dB 15 MB-OFDM I/N= 0.0 dB MB-OFDM I/N= 8.0 dB 10 noise alone 5 0 dBV relative to mean -5 -10 -15 -20 -25 -30 0.0001 0.01 0.1 1 5 10 20 30 40 50 60 70 80 90 95 98 99 percent exceeding ordinate APD analysis proves large impact (5 dB as claimed by Freescale) is only possible when a large bandwidth receiver with no FEC is in extremely close proximity to a MB-OFDM device. Joint probability of this event is vanishingly small.
Variation with Victim Rx BW APD plots for MB-OFDM using 1,1,3,3,2,2 TFI code APD plots for MB-OFDM using 1,2,3,1,2,3 TFI code 20 20 bw=2MHz bw=2MHz bw=4MHz bw=4MHz bw=8MHz bw=8MHz 10 10 bw=16MHz bw=16MHz bw=32MHz bw=32MHz 0 0 Amplitude relative to mean [dBV] -10 -10 -20 -20 -30 -30 -40 -40 -50 -50 0.0001 0.01 0.1 1 5 10 20 30 40 50 60 70 80 90 95 98 99 0.0001 0.01 0.1 1 5 10 20 30 40 50 60 70 80 90 95 98 99 percent exceeding ordinate percent exceeding ordinate • In bandwidths of 4MHz or less, the MB-OFDM waveforms are nearly identical to an ideal AWGN source for any given probability. • For large bandwidths, the APDs are almost identical regardless of which TFI code is used (1,2,3,1,2,3 or 1,1,3,3,2,2).