Download

1 / 52
530 likes | 649 Views
EI Monitoring – Science Challenges. Condition Monitoring. Monitoring conducted over the whole park in the long term to detect major trends in park EI - “What is the state of park EI?”. Management Effectiveness Monitoring.

E N D
Condition Monitoring Monitoring conducted over the whole park in the long term to detect major trends in park EI - “What is the state of park EI?” Management Effectiveness Monitoring Monitoring conducted over small areas to assess the effectiveness of specific park management actions – “What are we doing to improve park EI?”
Common Issues/Common Solutions Given the same missing program elements we can work together to develop common solutions to park EI monitoring and reporting issues • Generally the same elements are missing in almost all park monitoring programs • Permanent, long term monitoring of ecosystem process measures at local and landscape scales • conceptual ecosystem models linking EI components (biodiversity, processes, stressors) for major park ecosystems to EI Measures and Indicators • ‘final suite’ of EI measures • management targets and thresholds for EI Measures • assessment methodologies for EI Indicators
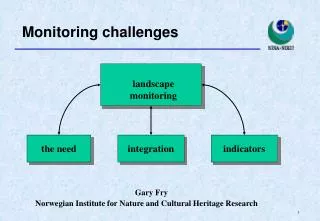
Science Challenges • How do we ‘capture EI’? • What do we measure? • What do our measurements mean? • Communicate!!!
‘Capturing EI’ • EI monitoring framework • major park ecosystems as EI indicators • core conceptual ecosystem models • local and landscape scales of measurement
Ecosystem Realms and Major Park Ecosystems UPLANDS forests/woodlands arctic/alpine tundra grasslands other non-forested WETLANDS beaches dunes cliffs riparian, wetlands COASTAL estuaries inter-tidal sub-tidal near-shore pelagic rivers/streams lakes/ponds lagoons FRESHWATER MARINE *MPEs for Great Lakes Bioregion
EI Indicator major park ecosystems Concerned EI Impaired High EI Public environment Science environment feedback biodiversity/processes human dimension models statistics stressors measures/data
Ecological Integrity Monitoring Framework Biodiversity Process and Function Stressors • Species richness • - change in species richness* • - numbers and extent of exotics* • Population Dynamics • - mortality/natility rates of indicator species* • - immigration/emigration of indicator species* • - population viability of indicator species* • Trophic structure • - size class distribution of all taxa • predation levels • Succession/retrogression • - disturbance frequencies and size (fire. insects, flooding)* • - vegetation age class distributions* • Productivity • - landscape or by site • Decomposition • -by site • Nutrient retention • Ca, N by site • Human land-use patterns • - land use maps, roads densities, population densities.* • Habitat fragmentation • - patch size, inter-patch distance, forest interior* • Pollutants* • - sewage, petrochemicals etc. • - long-range transport of toxics • Climate* • - weather data • - frequency of extreme events • Other* • park specific issues
Ecologically Comprehensive EI FRAMEWORK EI INDICATOR* Biodiversity Processes Stressors √ √ √ √ √ √ √ √ √ √ √ √ √ √ √ √ √ √ √ √ √ * EI indicators for Atlantic-Quebec Bioregion
Forest EI Indicator Concerned Critical Healthy Stand Level Forest EI Landscape Level Forest EI Models tree productivity, songbird index, salamander populations change, foliar nutrient index, decomposition efficiency FF BioD Index (SAR, top predators, ungulates), CFBioD Index (ecosystem representation), connectivity, productivity Measures dbh, canopy condition, species composition, chopstick dry weight loss, songbird/salamander density, relative soil arthropod abundance, foliar nutrient concentrations SAR and other species population assessments, relative ecosystem abundance, Fragstats, AVHRR Data
Core Bioregional Forest Stand Model carnivores climate change trampling/ disturbance predation herbivores hyper-abundant ungulates herbivory decomposition vegetation acid deposition nutrient/moisture uptake soil humus mineral soil
Core Bioregional Forest Landscape Model size, vigour and genetic diversity of focal herbivore populations size, vigour and genetic diversity of focal carnivore populations predation habitat effects hunting trapping herbivory spatial character, composition and productivity of forest communities landform processes acid deposition climate change distribution and character of park landforms (floodplains, moraines, karst, organics, avalanche tracks, glaciers, glacial outwash) disturbance
Roles of Ecosystem Conceptual Models • reduce ecosystem complexity:essential components of biodiversity, processes and stressors (EI) to prioritize monitoring measures; organize protocols and measures • COMMUNICATE approach and results: • science peers inside and outside parks • park managers, interpreters etc • all Canadians • improve EI assessments:conceptually related and co-located measures (long term plot data) provides internal logic • incorporate other park management activities:ecological frame for including restoration, infrastructure changes, visitor changes, operational changes, etc
Forest EI Indicator Concerned Critical Healthy Stand Level Forest EI Landscape Level Forest EI Models tree productivity, songbird index, salamander populations change, foliar nutrient index, decomposition efficiency FF BioD Index (SAR, top predators, ungulates), CFBioD Index (ecosystem representation), connectivity, productivity Measures dbh, canopy condition, species composition, chopstick dry weight loss, songbird/salamander density, relative soil arthropod abundance, foliar nutrient concentrations SAR and other species population assessments, relative ecosystem abundance, Fragstats, AVHRR Data
CWD,habitat structure/ channel stability human effects (fishing, invasive aliens, pollution) fish diversity index amphibians fish benthic invertebrate index filtering predation riparian condition flows/temperature/ water chemistry/ nutrients riparian vegetation benthic macroinvertebrates water flows, water quality water temperature allochthonous inputs herbivory riparian disturbance climate change periphyton macrophytes light/heat periphyton index Conceptual Model – Streams
Reporting Park EI 6-8 EI Indicators SOP synopsis (indicators) science foundation (measurements and models) Forests Wetlands Lakes Streams Marine Coastal
What to Measure and How to Measure it? • given the vast number of things we could measure, what do we measure? • PSOCLCIEIMs – the Holy Grail • measuring the park – study designs
The Holy Grail • To find a parsimonious suite of co-located, ecologically inter-related EI measures that provide a comprehensive summary of park forest EI at an acceptable financial and human resources cost
Forest EI Indicator Concerned Critical Healthy Stand Level Forest EI Landscape Level Forest EI Models tree productivity, songbird index, salamander populations change, foliar nutrient index, decomposition efficiency FF BioD Index (SAR, top predators, ungulates), CFBioD Index (ecosystem representation), connectivity, productivity Measures dbh, canopy condition, species composition, chopstick dry weight loss, songbird/salamander density, relative soil arthropod abundance, foliar nutrient concentrations SAR and other species population assessments, relative ecosystem abundance, Fragstats, AVHRR Data
Selecting Measures • cost-effective, information-rich, low signal to noise • credible – supported by science community/research • feasible to measure (technical field staff); ‘same day suites’ • comes with a ‘story’, e.g., soil arthropods? • works well as part of a ecologically-integrated suite that covers conceptual model components • shared by monitoring partners (provinces/territories, communities, model forests, industry)
Core Bioregional Forest Stand Model forest songbird guild densities forest salamander densities carnivores climate change trampling/ disturbance predation herbivores % dry weight loss of soil decomposition standard epidemic insect outbreaks (epidemics/5years) relative abundance of indicator soil arthropods hyper-abundant ungulates herbivory Forest vegetation plot: DBH/height increment of stand dominants; native/alien species diversity, tree canopy condition; tree recruitment and mortality, browse, arboreal lichens, decomposition vegetation acid deposition foliar nutrient concentrations (N, P, K, Ca, Mg) nutrient/moisture uptake soil humus mineral soil
Core Bioregional Forest Landscape Model focal ungulate populations (moose, deer. caribou, hare) focal predator populations (bear, wolf, coyote, fox) size, vigour and genetic diversity of focal herbivore populations size, vigour and genetic diversity of focal carnivore populations predation habitat effects human effects herbivory spatial character, composition and productivity of forest communities change analysis (fragmentation, focal species habitat suitability, ecosystem representation), productivity, phenology, alien species landform processes acid deposition climate change distribution and character of park landforms (floodplains, moraines, karst, organics, avalanche tracks, glaciers, glacial outwash) glacier changes, flooding regimes, ice processes, avalanche rates disturbance
Establishing Long Term MonitoringGeneral Rules • For all EI indicators data on biodiversity, processes and stressors should be collected at 2 scales – local and landscape • Representative local ecosystems of the major park ecosystem (forest stands, eelgrass beds, stream reaches, kelp beds, wetland types) need to be selected for measurement based on available resources, park management priorities and bioregional approaches • Whole park and greater park measures and assessments of indicators based on EO/RS – GIS data
Selecting ‘Representative Ecosystems’ • average (mesic) ecosystems • most abundant ecosystems • ecosystems with high conservation importance • ecosystems most sensitive to known stressors • base poor ecosystems susceptible to acid rain • droughty ecosystems where prolonged summer drought is forecast
Legend = Bird sample point = Salamander board = Vegetation plot = Potential vegetation plot Scale: 1 cm = 1 m N Arthropod traps 50m 5m W E S
songbirds foliar nutrients defoliators veg plot salamanders soil insects decay sticks A CO-LOCATED, ECOLOGICALLY INTER-RELATED SUITE OF LOCAL FOREST EI MEASURES
Forest EI Indicator Concerned Critical Healthy Stand Level Forest EI Landscape Level Forest EI Models tree productivity, songbird index, salamander populations change, foliar nutrient index, decomposition efficiency FF BioD Index (SAR, top predators, ungulates), CFBioD Index (ecosystem representation), connectivity, productivity Measures dbh, canopy condition, species composition, chopstick dry weight loss, songbird/salamander density, relative soil arthropod abundance, foliar nutrient concentrations SAR and other species population assessments, relative ecosystem abundance, Fragstats, AVHRR Data
Targets and Thresholds • What’s the question? • What’s the answer? • Developing targets and thresholds.
The question is…………. “What is the state of park EI?”
acid deposition heat/moisture vertebrate predators condition of litter inputs climate change Dry Weight Loss of Wood Decomposition Standard Ecological Effects nutrient availability/uptake foliar nutrient content plant productivity plant vigour pests and pathogens herbivore/predator effects rate of humus decomposition (percent dry weight loss) Humus Decomposition Sub-model soil biota interactions and processes
thresholds target confidence interval High EI concerned EI Impaired 82 62 30 20 baseline (mean) Targets, Baselines and Thresholds ‘precautionary principle’ 42 Dry Weight Loss of Wood Decomposition Standard (percent dry weight loss)
Establishing Targets and Thresholds Soil Decomposition Site 1 Landform: beach sands Soil: O.DYB moderately coarse, rapidly drained Veg Comm: Red Oak / Trembling Aspen Stand Origin: fire Site 5 Landform: glacio-marine Soil – O.GL; very fine, poorly drained Veg Comm: White Cedar / Balsam Fir Stand Origin: natural
Clear Monitoring Questions • H01: local scale (stand level) forest ecological integrity has not changed significantly over the last 5 years in mature eastern hemlock ecosystems in Kejimkujik NP • H01.1: soil humus decomposition has not changed more • than 35% • H01.2: forest salamander population densities have not • decreased more than 12% • H01.3: foliar N concentrations have not decreased more • than 0.5% foliar dry weight • etc
To monitor changes in nutrient cycling, we monitor soil decomposition using buried tongue depressors and measuring weight loss of the wood as an index of soil decomposition function Trees take up nutrients from the soil enhancing growth and delivering nutrients back to the ecosystem Tree needles, leaves, and branches fall to the forest floor Bacteria and fungi in the soil humus decompose the tree litter, making nutrients available for plant growth Communicating EI Monitoring Nutrient Cycling
‘Desired Condition’ forForest Landscapes: Rationale • most parks are not ‘natural’ and have had historical impacts that require management/restoration • active landscape management is required to meet park conservation needs – prescribed burning, ecosystem restoration, species re-introductions, alien invasives • management activities require performance reporting targets to assess progress towards desired goals; landscape targets will be set against patterns of natural successions and disturbance • ‘Desired condition’ targets for terrestrial landscapes need to be based on ‘desired conservation services’ the landscape can realistically provide
‘Desired Condition’ forForest Landscapes: Conservation Services • Habitat suitability: for focal species, e.g., charismatic, major park ungulates and carnivores, indicators, keystones, species at risk • Ecosystem representation: rare ecosystems, old forests, structural stage targets • Landscape productivity: within historical range of productivity as measured by NDVI or NPP • Landscape pattern: desired states for connectivity/fragmentation • Landscape processes: ice features (permafrost, thermokarst, solifluction etc), flooding regimes, mass wasting rates, • Operational and safety needs: fire/fuel management, RoWs, roads and visitor access/use, harvesting
Time 1 Time 2 Desired Landscape Condition EI Assessment of Change Analysis Data
Hypothesis Testing/Monitoring Questions • H01: landscape scale forest ecological integrity has not changed significantly over the last 5 years in Kejimkujik NP • H01.1: fragstat index target • H01.2: forest ecosystem representation target • H01.3: white tailed deer density is between 0.25 and 0.75 animals/ha • H01.4: cow:calf ratio in white tailed deer is greater than 1.2 • H01.5: NPP of forest landscapes is between ? and ? • etc
EI Assessments • What is the state of park EI? • How to defensibly Integrate and assess monitoring results to report the state of the park? • IBI approaches – stress gradients • ‘Internal logic’ / rule systems based on conceptual ecosystem models
Stress Gradients Bruce Peninsula National Park
- Pendall Point = 25 - Rocky Bay = 39 Measures to Indicators Simple Roll Up 1 3 5 salamander abundance 0 15 30 45 forest bird richness BIODIVERSITY 0 7.3 14.6 22 effective patch size 0.2 26.3 52.6 78.4 decomposition 11% 37% 63% 89% regeneration (height class) PROCESSES 0 3 6 13 productivity (NDVI) 0.1 0.4 0.7 0.9 lichen diversity 14 21 28 35 crown vigor STRESSORS 20% 10% 5% 0% fragmentation (ENN) 250 184 117 50
bootstrapped percentiles from across monitoring stations 9 21 33 45 Site Comparison graphical & numerical representation 22 - South Cameron Lake 27 - Fathom Five Landbase Forest Indicator = 31 (±2.4) 29 - Emmett Lake 25 - Pendall Point but close to 34 - Cameron Lake Dunes 42 - Shouldice Lake 30 - Horse Lake Trail 39 - Rocky Bay Measures to Indicators Simple Roll Up