Download
1 / 23
230 likes | 361 Views
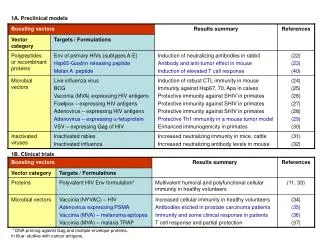
The Role of Preclinical Models to Identify Novel Therapeutics in Rare Cancers. Peter J. Houghton, Ph.D. St. Jude Children’s Research Hospital. How To Select New Agents for Clinical Trials? Rationale for the Pediatric Preclinical Testing Program (PPTP). 400 new drugs in development.

E N D
The Role of Preclinical Models to Identify Novel Therapeutics in Rare Cancers Peter J. Houghton, Ph.D. St. Jude Children’s Research Hospital
How To Select New Agents for Clinical Trials? Rationale for the Pediatric Preclinical Testing Program (PPTP) 400 new drugs in development Drug Development NCI/Industry/Academia • Prioritization of agents for phase I • Establish relevant models that encompass clinical heterogeneity • Rational decisions to advance/stop development Phase I • Potential to focus phase II trials • Potential to identify sensitive tumors Phase II
Testing @ MTD Drug X Panel A Panel B Panel C Panel D Panel E Stage 1 Report 6 neuroblastomas Full Dose Response/PK Yes Active in Model(s)? Orthotopic Models No Yes Other Tumor Models Available? Yes Transgenic Models No Final Report Houghton et al. Clin Cancer Res. (2002) Overview of the PPTP Screen
Species Tolerance: Host tolerance leads to high systemic exposure to drug -overprediction. Low tolerance leads to low systemic exposure, and underprediction of drug activity. Why Do Preclinical Cancer Models Fail? • Tumor models do not recapitulate human cancer at • the molecular level • Preclinical tumor models do not encompass clinical heterogeneity • Criteria for defining ‘activity’ is more stringent in clinical trials • Clinical trials design ignores preclinical data
Tumor models do not recapitulate human cancer at the molecular level Molecular Characterization of Xenograft Tumor Models • Pediatric Preclinical Testing Program (PPTP) -Affymetrix (U133A) -SNP analysis (100K) -CGH • Pediatric Oncology Preclinical Protein-Tissue Array Project (POPP-TAP) -cDNA arrays -Tissue/Protein arrays How well do xenograft tumors represent the respective clinical disease?
Tumors Cluster Along Diagnostic Typeby Unsupervised Clustering cDNA Array:all 38,789 Good Quality Genes RH6 AS KCNR RH1 ? EWS SC/Orthotopic JHAN Javed Khan -POPP-TAP (subnitted)
Identify Xenografts That Recapitulate the Tumors of Origin. MDS 38,789 genes of primary/xeno/cell line: EWS/NB/RMS
ANN trained on tumors predict xenografts PPTP Lines -Rh41 -Rh10 -Rh28 -Rh30 -Rh36 -Rh18 PPTP Lines -SK-N-AS -NB-1643 -NB-1691 -NB-1771 -NB-EB -NB-SD -NB-1382
Preclinical tumor models do not encompass clinical heterogeneity Panels of Xenograft TumorsAccurately Reflect Clinical Responsiveness Vincristine 44% Cyclophosphamide 50% Actinomycin D 25% Topotecan 50% clinical responses
CCSK Fetal kidney HPLNR Wilms Xenograft Comparison of Expression Profiles in Kidney Tumors and Their Derived Xenografts ModelsClustering using 543 best classifiers >1Present (Affymetrix U133A)
CCSK Fetal kidney HPLNR Wilms Xenograft Wilm’s Tumor Xenografts Cluster with Their Clinical Samples
Criteria for defining ‘activity’ is more stringent in clinical trials Link Expression Profiles to Chemosensitivity to Identify Biomarkers of Response Chemosensitivity of Kidney Tumor Xenografts BMS247550
Kidney Tumors Non-GBM Brain Tumors Linking Chemosensitivty To Expression Profiling Neuroblastoma Rhabdomyosarcoma Osteosarcoma Glioblastoma Identifying Biomarkers For Predicting Drug- Responsive Populations
SJ-GBM2 NB-EBc1 SK-N-AS NB-1691 NB-1771 NB-1643 OS-164 OS-166 OS-187 CHL-79 SKNEP NB-132 WT-10 BT-39 Rh30 NB-SD WT-12 WT-14 WT-13 WT-11 WT-16 OS-17 OS-21 BT-28 BT-29 BT-46 BT-50 BT-45 D-456 BT-56 D-212 BT-41 BT-36 EW-8 EW-5 EW-1 Rh36 Rh10 Rh65 Rh41 Rh28 Rh18 OS-2 OS-1 ALL-19 Hierarchical Clustering Trusted samples based on LogSignal CV 0.5 Max-Min>=100 at least 3 Present (1113 probesets) ---------------------------------- Total no of records: Columns included: log2(dap086-u133v2_Signal), Z-scores (1), log2(dap110-u133v2_Signal), Z-scores (1), log2(dap113-u133v2_2_Signal), Z-scores (1), log2(dap111-u133v2_Signal), Z-scores (1), log2(dap121-u133v2_Signal), Z-scores (1), log2(dap073-u133v2_Signal), Z-scores (1), log2(dap078-u133v2_Signal), Z-scores (1), log2(dap077-u133v2_Signal), Z-scores (1), log2(dap074-u133v2_Signal), Z-scores (1), log2(dap075-u133v2_Signal), Z-scores (1), log2(dap071-u133v2_Signal), Z-scores (1), log2(dap070-u133v2_Signal), Z-scores (1), log2(dap069-u133v2_Signal), Z-scores (1), log2(dap084-u133v2_Signal), Z-scores (1), log2(dap079-u133v2_Signal), Z-scores (1), log2(dap085-u133v2_Signal), Z-scores (1), log2(dap083-u133v2_Signal), Z-scores (1), log2(dap081-u133v2_Signal), Z-scores (1), log2(dap076-u133v2_Signal), Z-scores (1), log2(dap082-u133v2_Signal), Z-scores (1), log2(dap068-u133v2_Signal), Z-scores (1), log2(dap072-u133v2_Signal), Z-scores (1), log2(dap080-u133v2_Signal), Z-scores (1), log2(dap092-u133v2_Signal), Z-scores (1), log2(dap093-u133v2_Signal), Z-scores (1), log2(dap103-u133v2_Signal), Z-scores (1), log2(dap101-u133v2_Signal), Z-scores (1), log2(dap102-u133v2_Signal), Z-scores (1), log2(dap106-u133v2_Signal), Z-scores (1), log2(dap100-u133v2_Signal), Z-scores (1), log2(dap099-u133v2_Signal), Z-scores (1), log2(dap104-u133v2_Signal), Z-scores (1), log2(dap105-u133v2_Signal), Z-scores (1), log2(dap089-u133v2_Signal), Z-scores (1), log2(dap095-u133v2_Signal), Z-scores (1), log2(dap094-u133v2_Signal), Z-scores (1), log2(dap096-u133v2_Signal), Z-scores (1), log2(dap097-u133v2_Signal), Z-scores (1), log2(dap098-u133v2_Signal), Z-scores (1), log2(dap091-u133v2_Signal), Z-scores (1), log2(dap090-u133v2_Signal), Z-scores (1), log2(dap109-u133v2_Signal), Z-scores (1), log2(dap108-u133v2_Signal), Z-scores (1), log2(dap112-u133v2_Signal), Z-scores (1), log2(dap107-u133v2_Signal), Z-scores (1) Empty values replaced by: 0 Clustering method: UPGMA (unweighted average) Similarity measure: Euclidean distance Ordering function: Average value
Group 1 versus Group 2 Osteosarcomas( Probesets >4-fold Ttest FDR<0.01) OS#1 OS#2
Chemosensitivity of Tumors in the PPTP Panel Vincristine
The PPTP • Richard Gorlick (osteosarcoma) • John Maris (neuroblastoma) • Henry Friedman (glioblastoma) • Richard Lock (ALL) • Pat Reynolds (in vitro testing) • Malcolm Smith (CTEP) • Javed Khan (NCI) • Geoff Neale (St. Jude) • Chris Morton (St. Jude; coordinator)
Testing @ MTD Drug X Panel A Panel B Panel C Panel D Panel E Stage 1 Report Full Dose Response/PK Yes Active in Model(s)? Orthotopic Models No Yes Other Tumor Models Available? Yes Transgenic Models No Final Report Houghton et al. Clin Cancer Res. (2002) Overview of the PPTP Screen
Model Systems for Drug Selection Drug Development NCI/Industry/Academia • Relevant models (panels). -molecular identity -encompass clinical heterogeneity • Rational decisions to advance/stop development based on PK parameters Phase I • Potential to focus phase II trials • Potential to identify biomarkers for patient selection Phase II