Download
1 / 15
180 likes | 776 Views
Bios 532 Circular Dichroism. Circular dichroism is a form of chiroptical spectroscopy. Chiroptical spectroscopy uses circularly polarized light, and commonly exploits differences in the interactions of asymmetric chromophores with left- and right-circularly polarized light.

E N D
Bios 532 Circular Dichroism
Circular dichroism is a form of chiroptical spectroscopy. Chiroptical spectroscopy uses circularly polarized light, and commonly exploits differences in the interactions of asymmetric chromophores with left- and right-circularly polarized light.
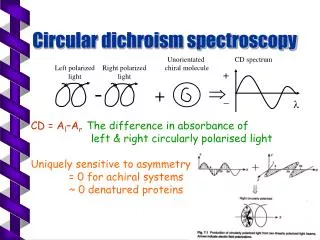
Propagates as a plane wave = linear polarization Two plane waves, equal amplitude, phase is 90 = circular polarization Two plane waves of differing amplitude, phase is 90 OR Two plane waves, equal amplitude, phase ≠ 90 = elliptical polarization natural light = unpolarized, propagates in all planes
The relationship between CD signal and the Beer-Lambert Law Alcp = lcplc for left circularly polarized light (lcp) The definition of CD is A = Alcp - Arcp = lcplc - rcplc = lc Where the difference in absorbance measured is equivalent to , the decadic molar CD.
The absorbance change in CD experiments is very small. Modern instruments can measure this value directly, but historically, CD was measured in terms of ellipticity. In the biochemical sciences, CD is commonly still expressed in terms of molar ellipticity, . The relationship between molar ellipticity and the change in absorption coefficient, , is: [] = 3298 ∆
A superposition of vectors of right- and left- circularly polarized light of equal amplitude and phase represents linearly polarized right. When an optically active sample differs in its absorbance for the right vs. left circular light, the resultant amplitude of the more strongly absorbed component will be smaller than that of the less absorbed component. The consequence is that a projection of the resulting amplitude now yields an ellipse instead of the usual line. http://www-structure.llnl.gov/cd/cdtutorial.htm
CD is used for proteins because of the chiral nature of the structural features of proteins - Biopolymers are intrinsically asymmetric; L-amino acids predominate over D-amino acids. L-alanine D-alanine Images from onlinediscussion of amino acid chirality: http://opbs.okstate.edu/~Blair/Bioch2344/Chapter7/Chapter7.htm
Amino acids Chromophores PHE, TRP, TYR - When an aromatic residue is held rigidly in space, its environment is asymmetric, and it will exhibit circular dichroism. Amide bond In secondary structure conformations, the backbone and the amide bond chromophores are arranged in regular, organized, asymmetric patterns.
Near UV CD (250 - 350 nm) Near-UV CD spectroscopy is dominated by Phe, Tyr, Trp and disulfides
Far UV CD (180 - 250 nm) The amide group is the most abundant CD chromophore in proteins. * transition ~ 190 nm n* transition ~220 nm
Far UV CD exhibits distinct spectra for -helical, -sheet, and random coil secondary structure. Brief CD tutorial online: http://www.cryst.bbk.ac.uk/cdweb/html/info_cd.html A more detailed tutorial: http://www.newark.rutgers.edu/chemistry/grad/chem585/lecture1.html
CD exhibits characteristic spectra for protein secondary structure features - alpha helix, beta sheet random coil • CD spectra can be deconvoluted using a set of basis spectra, but the analysis is difficult and contains bias dependent on the choice of reference spectra. • Primary uses for CD: • analyze structural changes in a protein upon some perturbation • compare the structure of a mutant protein to the parent protein • screen candidate proteins for more detailed structural analysis • (NMR or X-ray crystallography)