Fitting a Line to Data: Analyzing Correlation and Modeling Relationships
200 likes | 327 Views
Learn how to create scatter plots, analyze correlations, and model data through equations in this comprehensive guide. By exploring examples of positive and negative correlations, you'll discover how to effectively visualize relationships between variables, such as study hours versus test scores or fish lengths versus swimming speeds. Master the technique of drawing lines of fit to represent data trends and formulate equations for predictive modeling, using real-world examples like bird populations. Get hands-on practice with creating and interpreting scatter plots!

Fitting a Line to Data: Analyzing Correlation and Modeling Relationships
E N D
Presentation Transcript
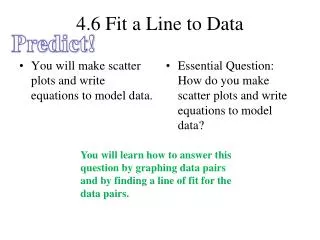
4.6 Fit a Line to Data Predict! • You will make scatter plots and write equations to model data. • Essential Question: How do you make scatter plots and write equations to model data? You will learn how to answer this question by graphing data pairs and by finding a line of fit for the data pairs.
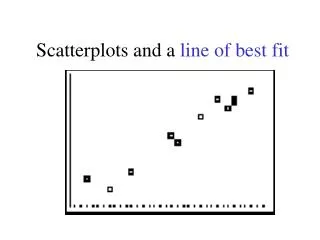
a. a. The scatter plot shows a positive correlation between hours of studying and test scores. This means that as the hours of studying increased, the test scores tended to increase. EXAMPLE 1 Describe the correlation of data Describe the correlation of the data graphed in the scatter plot.
b. b. The scatter plot shows a negative correlation between hours of television watched and test scores. that as the hours of television This means that as the hours of television watched increased, the test scores tended to decrease. EXAMPLE 1 Describe the correlation of data
1. Using the scatter plots in Example 1, predict a reasonable test score for 4.5 hours of studying and 4.5 hours of television watched. ANSWER Sample answer: 72, 77 for Example 1 GUIDED PRACTICE
EXAMPLE 2 Make a scatter plot Swimming Speeds The table shows the lengths (in centimeters) and swimming speeds(in centimeters per second) of six fish. a. Make a scatter plot of the data. b. Describe the correlation of the data.
SOLUTION a. b. The scatter plot shows a positive correlation, which means that longer fish tend to swim faster. EXAMPLE 2 Make a scatter plot Treat the data as ordered pairs. Let x represent the fish length (in centimeters), and let y represent the speed (in centimeters per second). Plot the ordered pairs as points in a coordinate plane.
2. Make a scatter plot of the data in the table. Describe the correlation of the data. ANSWER The scatter plot shows a positive correlation. for Example 2 GUIDED PRACTICE
EXAMPLE 3 Write an equation to model data BIRD POPULATIONS The table shows the number of active red-cockaded woodpecker clusters in a part of the De Soto National Forest in Mississippi. Write an equation that models the number of active clusters as a function of the number of years since 1990.
Make a scatter plot of the data. Let xrepresent the number of years since 1990. Let yrepresent the number of active clusters. EXAMPLE 3 Write an equation to model data SOLUTION STEP 1
EXAMPLE 3 Write an equation to model data STEP 2 Decide whether the data can be modeled by a line. Because the scatter plot shows a positive correlation, you can fit a line to the data. STEP 3 Draw a line that appears to fit the points in the scatter plot closely. STEP 4 Write an equation using two points on the line. Use (2, 20) and (8, 42).
42 – 20 y2 – y1 11 22 m = = = 8 – 2 = 3 x2 – x1 6 y = mx + b Substitute for m, 2 for x, and 20 for y. 11 20 = (2) + b 3 11 3 EXAMPLE 3 Write an equation to model data Find the slope of the line. Find the y-intercept of the line. Use the point (2, 20). Write slope-intercept form.
= b 38 11 38 11 38 3 3 3 3 3 x + x + . An equation of the line of fit is y = ANSWER The number yof active woodpecker clusters can be modeled by the function y = where xis the number of years since 1990. EXAMPLE 3 Write an equation to model data Solve for b.
3. Use the data in the table to write an equation that models yas a function of x. Sample answer: y = 1.6x + 2.3 ANSWER for Example 3 GUIDED PRACTICE
EXAMPLE 4 Interpret a model Refer to the model for the number of woodpecker clusters in Example 3. a. Describe the domain and range of the function. b. At about what rate did the number of active woodpecker clusters change during the period 1992–2000?
11 a. The domain of the function is the the period from 1992 to 2000, or 2 x 10. The range is the the number of active clusters given by the function for 2x10, or 20y49.3. 3 The number of active woodpecker clusters increased at a rate of or about 3.7 woodpecker clusters per year. b. EXAMPLE 4 Interpret a model SOLUTION
4. In Guided Practice Exercise 2, at about what rate does ychange with respect to x. ANSWER about 1.6 EXAMPLE 4 for Example 4 GUIDED PRACTICE
You will make scatter plots and write equations to model data. • Essential Question: How do you make scatter plots and write equations to model data? • A scatter plot shows whether there is a positive, negative, or no correlation in the data. • A line of fit can model data. The points you use to find the equation must be on the line, but they do not have to be actual data values. Plot paired data in a coordinate plane. For a positive or negative correlation, draw a line of fit, with about the same number of points above and below the line. Use two points on the line to find the slope and then use the slope and a point to find the y-intercept. Write an equation of the line.
ANSWER negative correlation. Daily Homework Quiz 1. Tell whether x and y show a positive correlation, a negative correlation, or relatively no correlation.
The table shows the body length and wingspan (both in inches) of seven birds. Write an equation that models the wingspan as a function of body length. 2. y = 3.1x– 10.3, wherexis body length andyis wingspan. ANSWER Daily Homework Quiz