Download
1 / 22
220 likes | 395 Views
Explain the following:- A is warmer than B in summer C is warmer than E in winter E has a greater annual range of temperature than C C is warmer than D in winter F is colder than D. World Climate. Objectives: Plot climate graph detail accurately

E N D
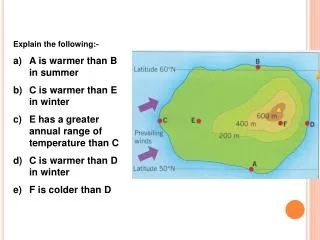
Explain the following:- • A is warmer than B in summer • C is warmer than E in winter • E has a greater annual range of temperature than C • C is warmer than D in winter • F is colder than D
World Climate Objectives: Plot climate graph detail accurately Use appropriate terminology to explain the pairing up of different climate graphs and the cities they are for
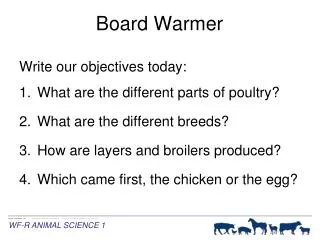
How to construct a climate graph… 1. Draw and label the axes (remember you need two names for the y axis – ‘temperature’ and ‘rainfall’ ).
always plot the temperature points in the middle of the months on the x axis How to construct a climate graph… 2. Work out the right scale for each axis (look at your highest temperature and rainfall figures). • Draw the graph using bars for rainfall and a line for temperature.
Animated European weather – temperature • Precipitation • Acuweather… satellite • Interactive climate graph map
Which climate graph goes with which city? 50° N Latitude Cork London Moscow Berlin
Which climate graph goes with which city? 50° N Latitude Cork London Moscow Berlin B D A C
Which climate graph goes with which city? 50° N Latitude Cork London Moscow Berlin Palma de Mallorca
World climates Your feedback should include: • Equatorial - page 212 • Tropical Continental - 213 • Monsoon - 214 • Mediterranean - 215 • Cold - 215 • Location • Temperature range • Precipitation • Humidity • Seasons • Reasons why the climate is like it is Worksheet 13.3 Climate Graphs Pages 212-215
Homework Produce a short research report on the climate of a country of your choice. You must include: • Location • Climate graph • Temperature range • Precipitation • Humidity • Seasons • Reasons why the climate is like it is